
The Major U.S. stock indices hit new All-Time Highs again this week with quad-witching and the inclusion of Tesla (NASDAQ:TSLA) in the S&P 500 index on Friday.

The Dow Jones Industrial Average is up >4,000 points (15%) since the Oct 30 Key Turn Date (circled on today’s charts) when a number of different markets all reversed “on a dime” as market psychology turned aggressively pro-risk. Pro-risk psychology kicked into overdrive on the November 9th Pfizer (NYSE:PFE) vaccine announcement.

The “Reflation/Rotation Trade” has driven the Russell 2000 small-cap index up ~30% since the end of October, blowing away the Dow Jones Industrial Average with its 15% gain and the once-mighty Nasdaq 100 which only rallied 16%.


Boeing (NYSE:BA) jumped more than 70% the last 6 weeks while mighty Apple (NASDAQ:AAPL) only gained 20%. Another “Rotation” trade.


The US dollar was hammered against virtually all currencies this week. The euro hit a 2 ½ year high and the Swiss franc had its highest weekly close in 6 ½ years.

A note of caution for USD bears: The Chinese Offshore Renminbi, which has rallied relentlessly against the USD since May 26th closed modestly weaker for the past 2 weeks. (In this chart the downtrend means it takes fewer and fewer RMB to buy one USD.)

The recent RMB weakness may be an early warning sign that the USD has fallen too far too fast. I say this because the RMB began its relentless rally on the same day that the USDX began its major decline. (Maybe I’m reaching to think that the thinly traded RMB could lead the FX market. Maybe I’m looking for a crutch to support my pro-USD bias. The USDX chart below certainly gives no hint that it’s about to turn higher.)

The commodity markets have been on fire since the end of October with WTI crude oil up ~44%, copper up ~20%, and soybeans up ~17%. The broad CRB commodity index is up ~11%. Teck Resources (NYSE:TECK), a major Canadian corporation that benefits from higher copper and crude oil prices has jumped >50% since the Key Turn Date.


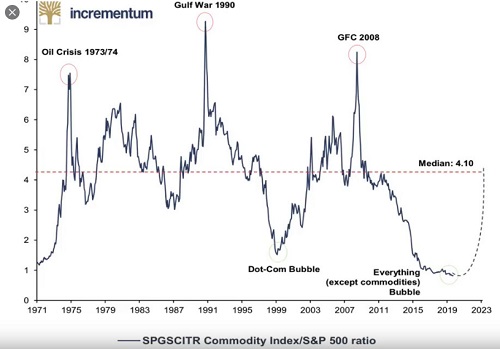
The commodity indices are around a 100 year low relative to the major American stock indices. There are lots of charts circulating that hint at the possibility of a major reflation trade. We may be due for another commodity bull market. The last one started around 2002 (following the collapse of the dotcom bubble) and ran to 2011. During that period China was buying “everything” and the USD was weak.

My short-term trading: I started this week with long T-Notes and short MEX positions. Both trades were an expression of my thinking that pro-risk market psychology had gone too far too fast. I had snugged stops tighter on both positions as they worked in my favor and was stopped for small gains on Monday.
I shorted S&P, Russell and CAD Monday but covered the same day for very small losses when those markets did not sustain weakness. Given the market action the rest of the week it was a good thing I got out.
I shorted CAD and MEX on Friday (both markets look short-term toppy) seeing those trades as a lower risk way to fade the bullish market psychology that seems to have permeated all markets. I remain short CAD and MEX into the weekend.


Best wishes to all of my readers everywhere for good health and happiness throughout the holiday season and into next year.