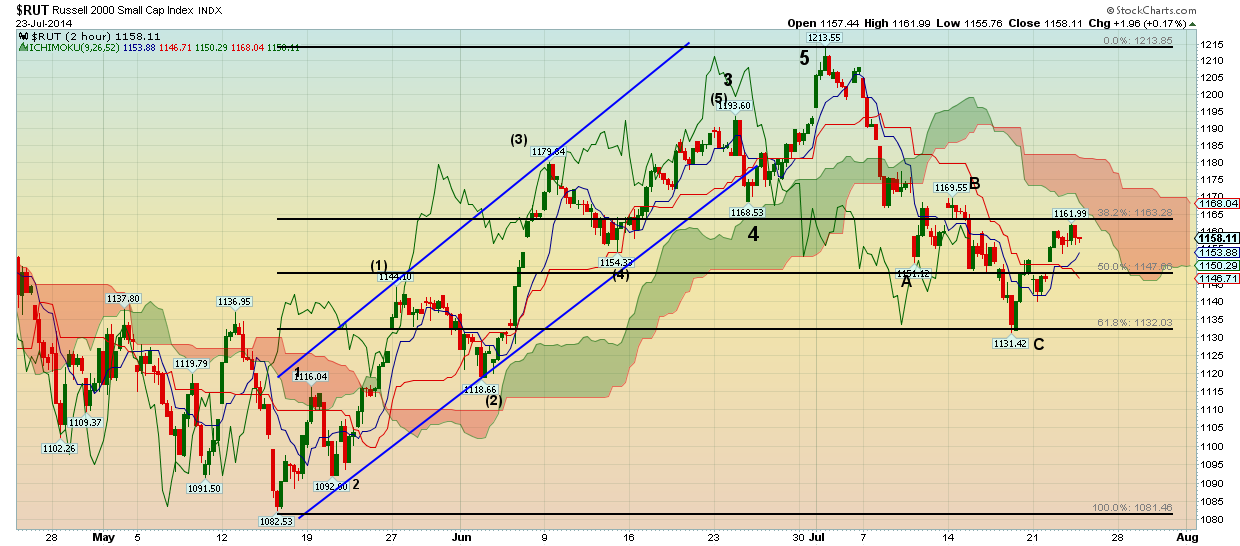
The Russell 2000 is our focus again as price has most probably completed the downward correction that started at 1213 and a new upward move is now in its early stages. The RUT index has completed 5 waves up from the 1080 area (mid-May) to 1213 (early July). The retracement was in a three wave form and stopped at the 61.8% Fibonacci retracement.

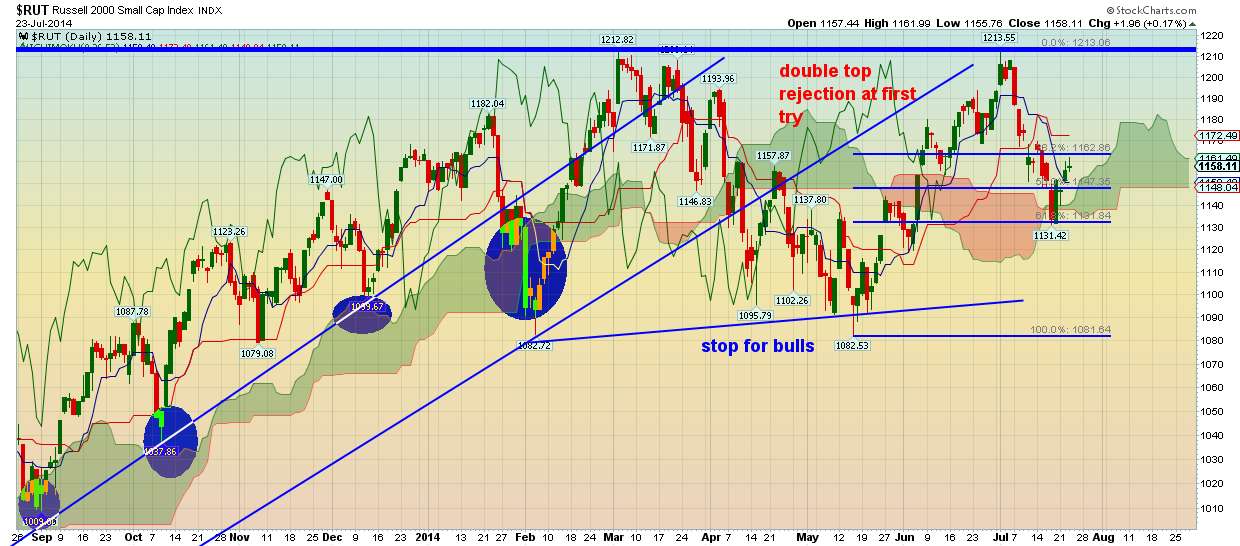
From the 61.8% Fibonacci retracement, the RUT index has started an upward bounce and resistance is now found at 1175 where the Ichimoku cloud in the 2 hour chart is found. Adding to long positions if we break above this area will be my strategy. As the daily chart below shows, price has not only bounced from the 61.8% retracement but also has managed to hold above the Ichimoku cloud. Trend is up and I believe we are at the beginning of a new upward move that will bring the index to new highs, at least near 1300-1400.

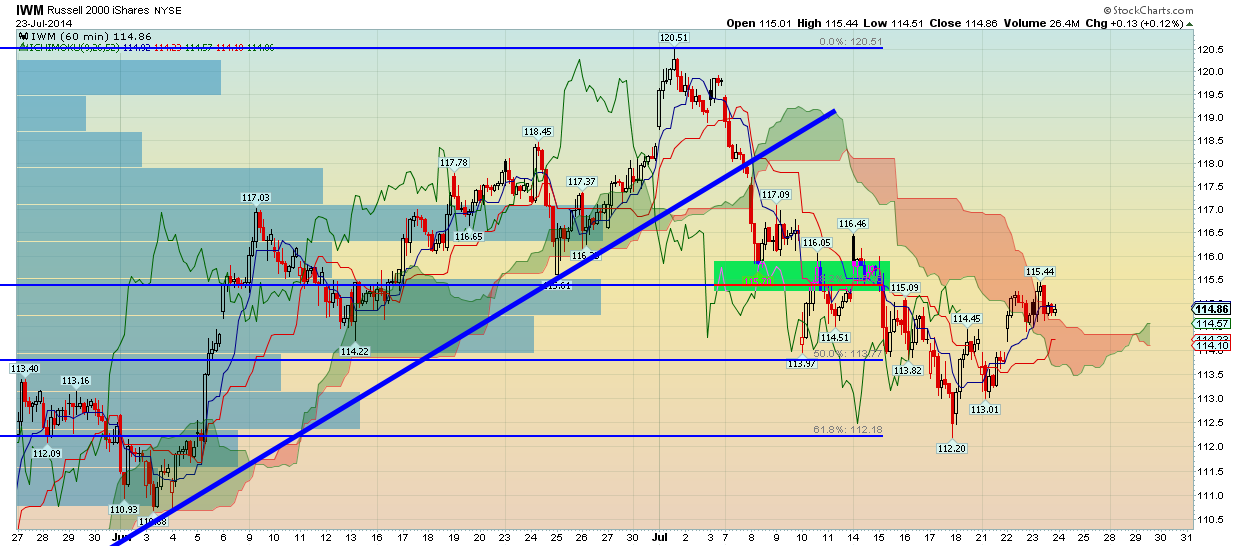
My strategy of entering long this index will be applied through the iShares Russell 2000 Index ETF (ARCA:IWM) which has the same technical characteristics as the RUT chart. Price bounced off the 61.8% retracement and the decline has no impulsive form. The rise from 107 is impulsive and I expect at least one more impulsive leg up.

US markets remain in bullish trend and I believe the RUT will outperform.
Disclosure: None of the information or opinions expressed in this blog constitutes a solicitation for the purchase or sale of any security or other instrument. Nothing in this article constitutes investment advice and any recommendations that may be contained herein have not been based upon a consideration of the investment objectives, financial situation or particular needs of any specific recipient. Any purchase or sale activity in any securities or other instrument should be based upon your own analysis and conclusions.
