Get 40% Off
🚨 Volatile Markets? Find Hidden Gems for Serious OutperformanceFind Stocks Now

Russell 2000: Is 10-15% Correction Imminent?

Published 02/10/2021, 02:23 PM
Updated 07/09/2023, 06:31 AM

Using the iShares Russell 2000 ETF (NYSE:IWM) as a proxy for the Russell 2000, my detailed Elliott Wave Principle (EWP) count and technical analyses suggest the index and ETF are closer to an interim top than a bottom.

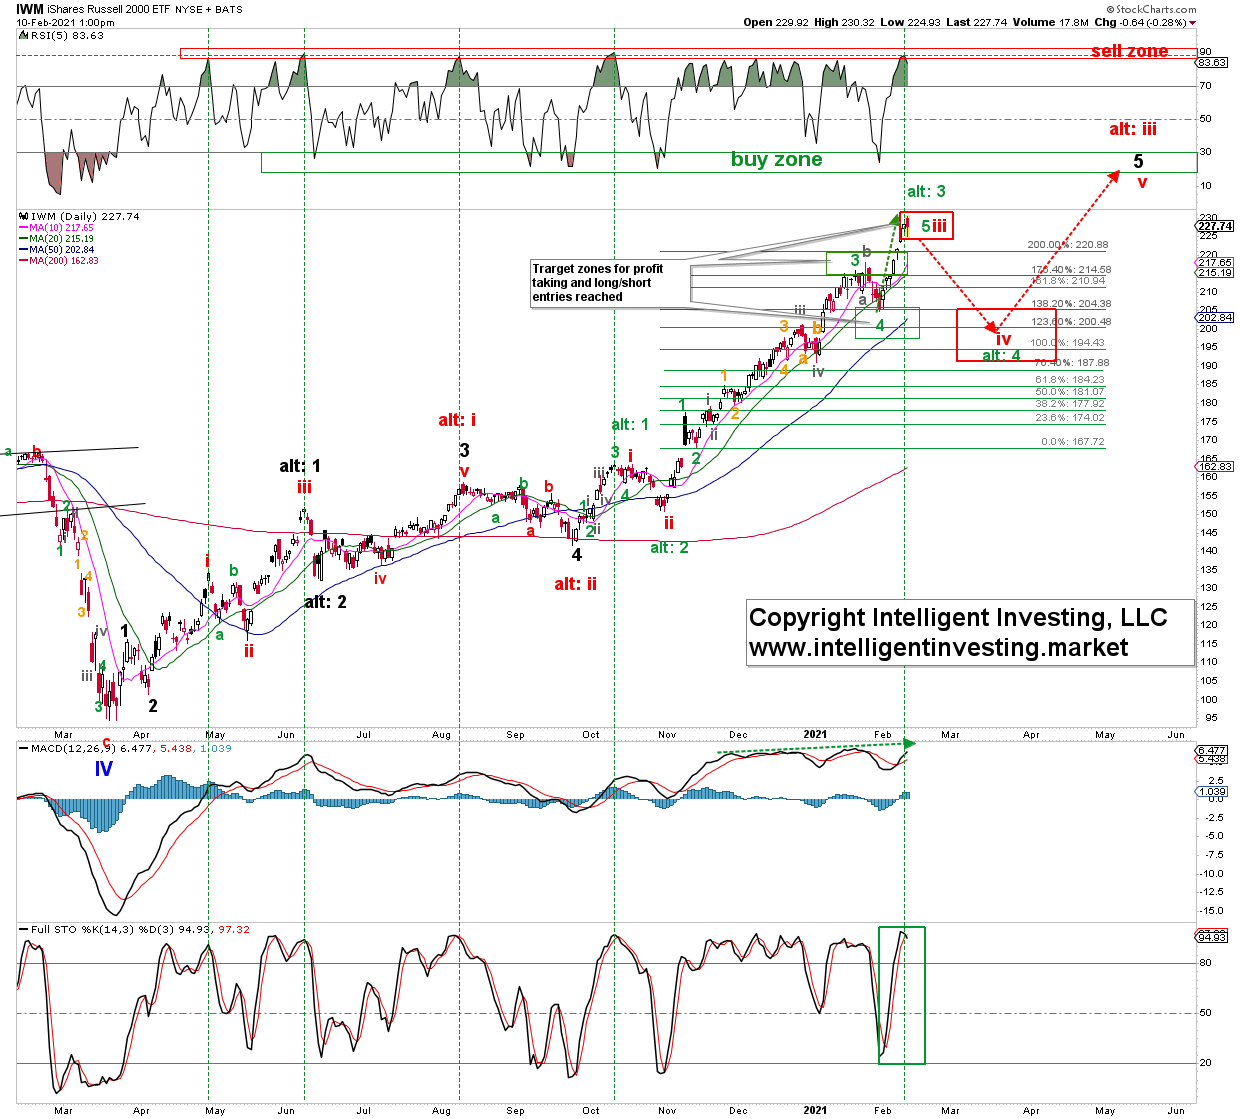
In early- and late-January, the IWM reached both the upside and downside target zones for the smaller degree, minor-3, -4 waves (in green), respectively. The target zones I outline in my daily reports can be used to buy and sell and set appropriate stop levels if the price moves higher or lower. See figure 1 below.

Figure 1: Daily IWM candlestick chart, with detailed EWP count and technical indicators:
IWM Daily Chart.

The ETF has now reached the next upside target zone in red, for the potential completion of (green) minor-5 of (red) intermediate-iii. Alternatively, the pending top is a one-degree lower 3rd wave. Time and the charts will tell, but it never hurts one’s portfolio to err on the side of caution and stick with the less bullish count until proven otherwise.

As you can see, the daily RSI5 indicator reached maximum overbought conditions yesterday. If history, i.e., the rally since the March 2020 low, is of any help, each time the RSI5 got this overbought, the index and ETF faced headwinds relatively soon. We can still see marginal higher prices for the completion of some micro-waves to around $230+, but it appears based on the EWP count and RSI5 set up, the downside risk is now more considerable than upside potential.

Waiting for the next larger pullback, which can be anywhere from 10-15% from current levels, seems, therefore, a much more sound and profitable strategy than chasing most likely minimal upside reward. A close below Monday’s open will confirm the correction is under way. I then anticipate the red dotted arrows to be the path over the next several weeks. Note: 4th waves are notoriously tricky, so that the pending correction may have several tricks up its sleeve.

3rd party Ad. Not an offer or recommendation by Investing.com. See disclosure here or remove ads .

Latest comments

it is an broader index, money might rotate from one sector to another within it but over the index would out perform individual sectors. even the sectors that have been hot or hotter lately like retail, energy etc. they are still far off their highs pre 2020, they are actually late to arrive and has quite long way to climb up. so overall I see more back and fill than a correction.
Will see.
I like your idea here. I have a database of all of the Russell 2000 member stocks and the P/S, P/B, P/S, P/FCF are all at crazy extremes. Look out below. Thanks for a good article!
yes it is. but not necessarily from this level.
Risk Disclosure: Trading in financial instruments and/or cryptocurrencies involves high risks including the risk of losing some, or all, of your investment amount, and may not be suitable for all investors. Prices of cryptocurrencies are extremely volatile and may be affected by external factors such as financial, regulatory or political events. Trading on margin increases the financial risks.
Before deciding to trade in financial instrument or cryptocurrencies you should be fully informed of the risks and costs associated with trading the financial markets, carefully consider your investment objectives, level of experience, and risk appetite, and seek professional advice where needed.
Fusion Media would like to remind you that the data contained in this website is not necessarily real-time nor accurate. The data and prices on the website are not necessarily provided by any market or exchange, but may be provided by market makers, and so prices may not be accurate and may differ from the actual price at any given market, meaning prices are indicative and not appropriate for trading purposes. Fusion Media and any provider of the data contained in this website will not accept liability for any loss or damage as a result of your trading, or your reliance on the information contained within this website.
It is prohibited to use, store, reproduce, display, modify, transmit or distribute the data contained in this website without the explicit prior written permission of Fusion Media and/or the data provider. All intellectual property rights are reserved by the providers and/or the exchange providing the data contained in this website.
Fusion Media may be compensated by the advertisers that appear on the website, based on your interaction with the advertisements or advertisers.
© 2007-2024 - Fusion Media Limited. All Rights Reserved.