Thursday Mar 1: Five things the markets are talking about
US equities suffered their worst monthly decline in two years last month as investors continued to digest new Fed Chair, Jerome Powell’s, Tuesday’s comments. The S&P 500 Index slumped more than -1% yesterday, ending February with a decline of -4%.
US Treasuries and the dollar trade somewhat steady as the market awaits his second appearance this morning (10 am EST). Powell is due to testify on the Semi-annual Monetary Policy Report before the Senate Banking Committee, in Washington.
His comments this week has kept the door ajar to speculation that the Fed may want to quicken the pace of monetary tightening.
1. Stocks trade under pressure
In Japan, the Nikkei share average closed atop of its two-week low overnight as market sentiment was hit by the rout stateside on Wednesday. The Nikkei closed out -1.6% lower, while the broader TOPIX declined -1.7%.
Down-under, the Aussie ASX 200 declined -0.7%, weighed down mostly by mining heavyweights as commodity prices weakened, while the broader market retreated on fears of rising US interest rates. In S. Korea, the Kospi was closed for a holiday.
In Hong Kong, stocks fell to a two-week low. The Hang Seng index ended down -1.4%, while the Hang Seng China Enterprise (CEI) index declined -2.1%.
In China, stocks recouped earlier losses to climb as consumer and banking firms rose, after a private survey showed the country’s factory growth rose to a six-month high in February. At the close, the Shanghai Composite index was up +0.6%, while China’s blue-chip CSI300 index was up +0.9%.
In Europe, regional Indices trade lower across the board following yesterday’s weaker close on Wall street , and mostly weaker markets in the Far East.
US stocks are set to open in the ‘red’ (-0.2%).
Indices: STOXX 600 -0.9% at 376.1, FTSE -0.5% at 7195, DAX -1.4% at 12259, CAC 40 -1.1% at 5264, IBEX 35 -1.0% at 9745, FTSE MIB -0.8% at 22421 , SMI -0.9% at 8828, S&P 500 Futures -0.2%

2. Oil prices capped, gold lower
Oil prices remain capped after US federal data yesterday showed that oil and gas are building up in storage even as US oil production continues to climb.
In the US, crude inventories grew by +3m barrels last week, and gas increased by +2.5m barrels, according to yesterday’s US EIA report. The market had correctly anticipated an increase, but a smaller one.
Note: On Tuesday the API group, an industry group said that its data for the week showed a +933k barrel increase in crude supplies, a +1.9m barrel rise in gas stocks and a -1.4m barrel decrease in distillate inventories.
Brent crude for May delivery is up +17c, or +0.3% at +$64.90, while the US West Texas Intermediate (WTI) for April delivery is up +13c, or +0.2% at +$61.77 a barrel.
Note: Both benchmark contracts fell nearly -5% in February, the first monthly declines in six-months.
Ahead of the US open, gold prices have dipped, pulled down, as the dollar remains better bid following Fed Chairman Powell’s comments that fanned concerns of faster-than-expected rate hikes in the US. Spot gold is -0.2% lower at +$1,315.36 an ounce. Prices have fallen about -1% so far this week.

3. Sovereign yields remain elevated
With central banks beginning to reduce their balance sheets should start to have a bigger effect on currencies. Policy normalization should lead to increased market volatility and also continue to impact the cost of hedging FX transactions.
Stateside, Treasury yields have notched another monthly advance in February. The yield on the US 10-year note has now risen for five of the past six-months as investors worry that inflation could be accelerating and that there may not be enough demand to meet additional Treasury’s issuance.
The yield on US 10’s has gained less than +1 bps to +2.86%. In Germany, the 10-year Bund yield has fallen less than -1 bps to +0.65%, the lowest in almost five weeks. In the U.K, the 10-year Gilt yield has declined -6 bps to +1.501%, the lowest yield in a month and the largest intraday fall in almost two-weeks.

4. Sterling selling back in vogue on Brexit fears
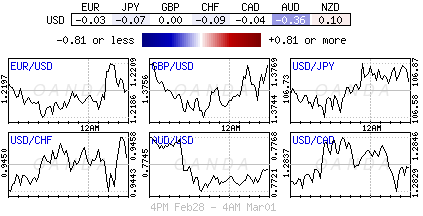
Selling sterling on concerns about the lack of progress in Brexit negotiations is back in fashion. The pound was driven to a two-week low outright overnight after the EU published a draft Brexit withdrawal agreement. However, Prime Minister May has said she cannot accept the E.U’s proposals on the Northern Ireland border. GBP/USD last traded flat at £1.3759, up from around £1.3747 before this morning’s PMI data (see below). EUR/GBP trades roughly flat at €0.8858, having traded at around €0.8867.
Note: PM May’s will deliver a speech in Sunderland tomorrow (Mar 2) on the ” U.K’s relationship with E.U.” There is no specific time or location that has been announced yet. She has picked a strong pro-Brexit area and one that has not voted Tory in generations.
Elsewhere, the euro has gained less than +0.05% to €1.2197.The Japanese yen dipped -0.2% to ¥106.86, while the South African rand sank -0.4% to $11.8485, the weakest in more than two-weeks.

5. German manufacturing revised higher, UK manufacturing lower
Data this morning showed that Germany’s manufacturing PMI for February was revised up a tad to 60.6 from its flash estimate of 60.3. Digging deeper, rising input costs led many German manufacturers to increase prices – capacity issues have allowed vendors to negotiate higher prices as demand outstrips supply.
In the UK, manufacturing PMI for February came in at 55.2, down just slightly from January’s 55.3 and in line with market expectations.