Get 40% Off
🚨 Volatile Markets? Find Hidden Gems for Serious OutperformanceFind Stocks Now

Rotation Trade From The Overvalued Into The Less Overvalued Continues

Published 03/11/2021, 12:47 AM
Updated 09/20/2023, 06:34 AM

It was a mixed day for stocks on Wednesday, with the S&P 500 up and the NASDAQ 100 down. We continue to see this rotation trade taking place. Some of these “value” stocks aren’t the value they may seem to be. Still, it is more of a trade out of the overvalued technology and discretionary names into the less overvalued industrial, materials, and financial names.

I wouldn’t be surprised if we saw the S&P 500 fill gaps at lower levels the rest of the week. Yesterday it appears we completed a rising wedge on the intraday charts and failed upon retest resulting in the breakdown. Based on that, a drop back to 3,875 seems reasonable and probably a push lower back to 3,820.

It seems there is too much resistance at this 3900 level, while option positioning appears to be creating a headwind. Unless we gap sharply higher today, above yesterday’s highs, I think the likelihood is that we trade down the next couple of days.
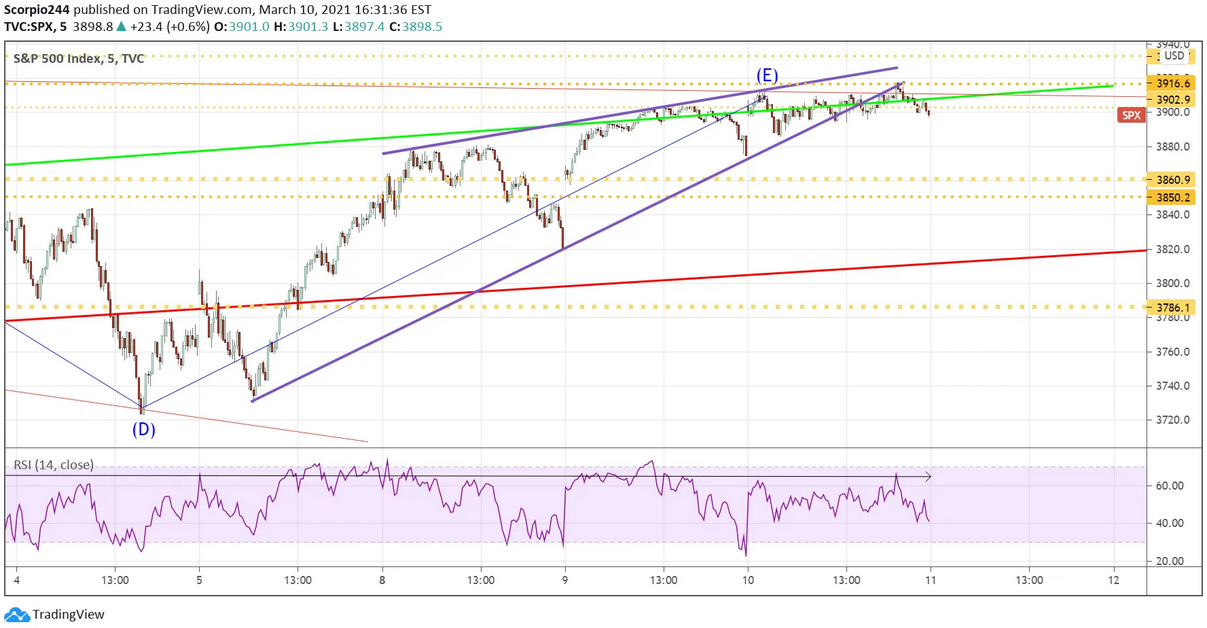
S&P 500 Index Chart

US 10-Year

US 10-year yields continue to trend higher, despite trading flat yesterday. The CPI data came in mostly in line, while the core readings were 10 bps below expectations. The results were not enough to move the needle.

So the interesting thing will be what happens with the PPI on Friday. It is expected to climb by 2.7% on a year-over-year basis. That is 1% higher than yesterday’s CPI. If that type of trend continues, it will imply that producers of goods cannot pass along their rising cost to consumers; what happens to margins at that point?

3rd party Ad. Not an offer or recommendation by Investing.com. See disclosure here or remove ads .

I tend to think that inflation fears overall will die down by the late summer or fall, but in the meantime, the market could have a field day with margin compression worries, especially with earnings multiples at these levels. Just thinking about what comes after the inflation worries.
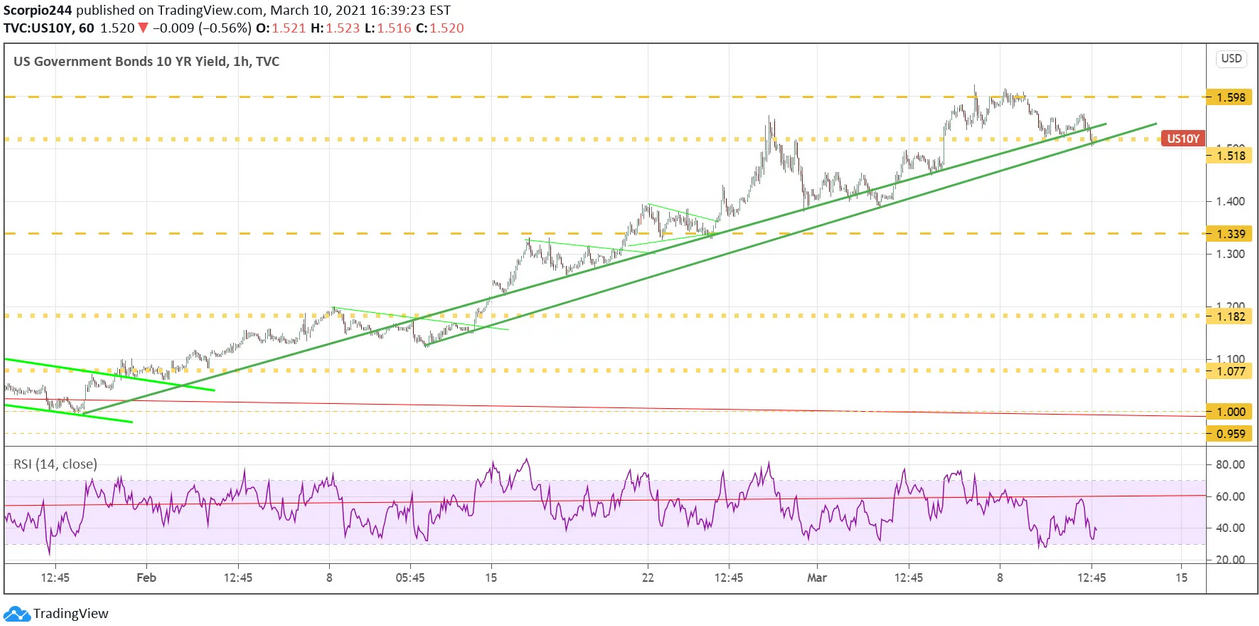
UST 10 Yr Yield 1-Hr Chart

NVIDIA

NVIDIA (NASDAQ:NVDA) tested resistance yesterday at $520 and failed, trading lower by 40 bps. The stock probably has further to fall, and it wouldn’t surprise me. The valuation is high, and the more rates rise, the lower it will need to go.
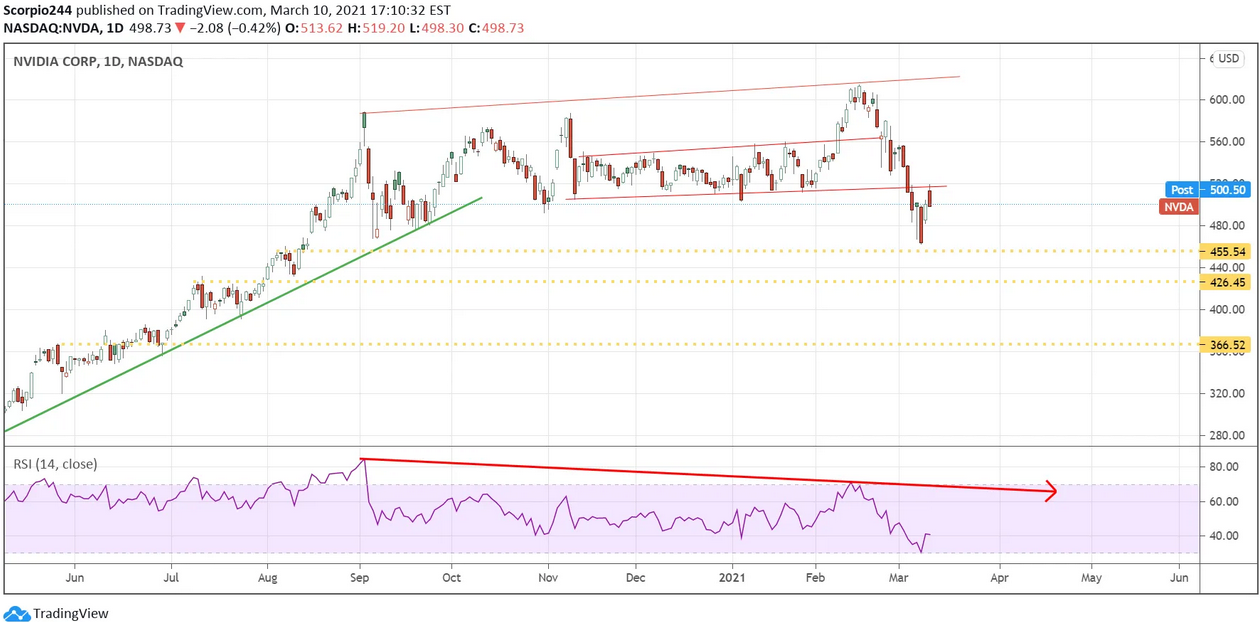
NVIDIA Corp Daily Chart

Micron Technology

Micron (NASDAQ:MU) is acting a little funny here, and I don’t like that the RSI is diverging from the price. The stock is now sitting right on the uptrend, and a drop below $85 pushes it back to $75.
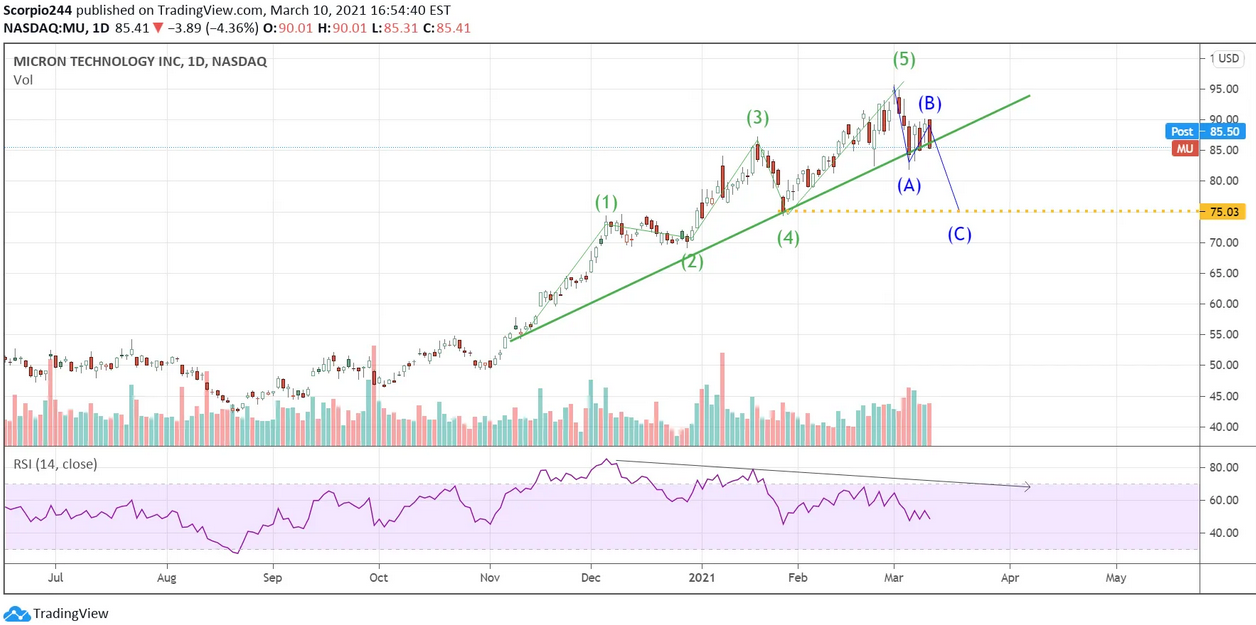
Micron Tech Inc Daily Chart

Taiwan Semi

There is an amazing-looking descending triangle that is present in Taiwan Semiconductor (NYSE:TSM). That is a bearish pattern by the way. A drop below $113, probably pushes the shares back to $105.
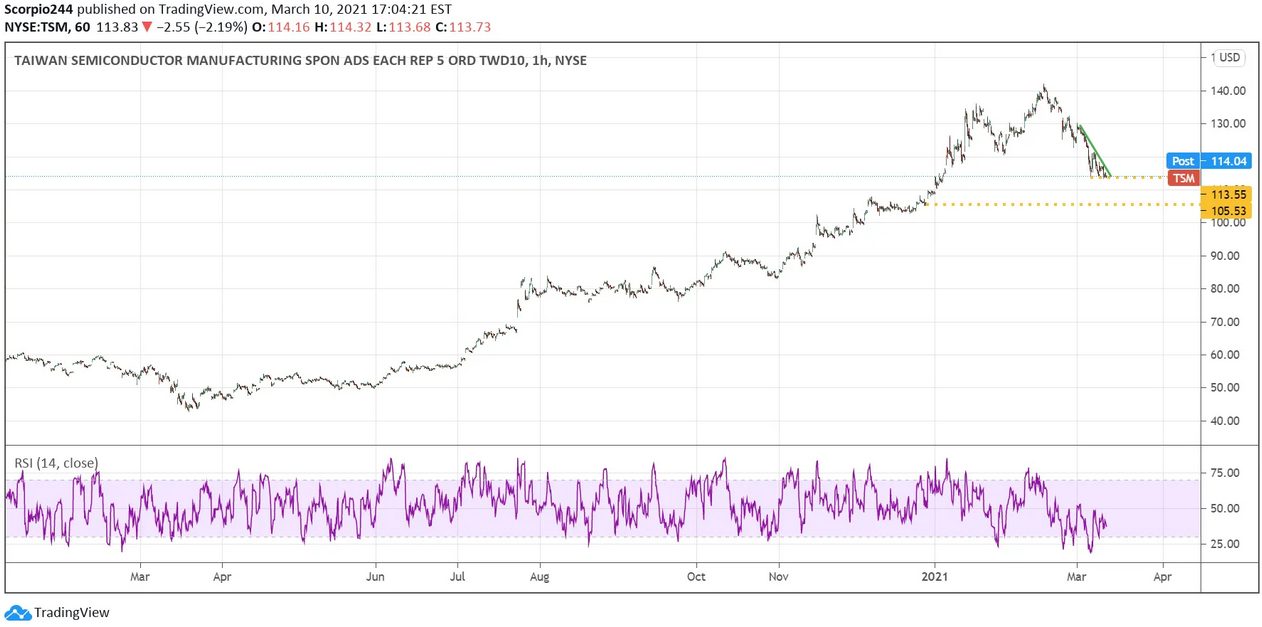
TSM 1-Hr Chart

Original Post

Latest comments

Perfect title!
Tankers are still way under NAV.
In agreement with you on technology, but I think value has higher prices to go. Also see the 10 year nearing 2% by June. Oil I see getting ready to sky rocket to 75 buy May -Jun and if Saudia+ does not extend by April we are off to the races 110 by year end, and if you don't think
Risk Disclosure: Trading in financial instruments and/or cryptocurrencies involves high risks including the risk of losing some, or all, of your investment amount, and may not be suitable for all investors. Prices of cryptocurrencies are extremely volatile and may be affected by external factors such as financial, regulatory or political events. Trading on margin increases the financial risks.
Before deciding to trade in financial instrument or cryptocurrencies you should be fully informed of the risks and costs associated with trading the financial markets, carefully consider your investment objectives, level of experience, and risk appetite, and seek professional advice where needed.
Fusion Media would like to remind you that the data contained in this website is not necessarily real-time nor accurate. The data and prices on the website are not necessarily provided by any market or exchange, but may be provided by market makers, and so prices may not be accurate and may differ from the actual price at any given market, meaning prices are indicative and not appropriate for trading purposes. Fusion Media and any provider of the data contained in this website will not accept liability for any loss or damage as a result of your trading, or your reliance on the information contained within this website.
It is prohibited to use, store, reproduce, display, modify, transmit or distribute the data contained in this website without the explicit prior written permission of Fusion Media and/or the data provider. All intellectual property rights are reserved by the providers and/or the exchange providing the data contained in this website.
Fusion Media may be compensated by the advertisers that appear on the website, based on your interaction with the advertisements or advertisers.
© 2007-2024 - Fusion Media Limited. All Rights Reserved.