
Equities tumbled yesterday and today in Asia, with most of the benchmark indices falling more than 2%, due to warnings by Chinese regulators that Evergrande’s $305bn worth of liabilities could result in risks to the broader financial system if its debts are not stabilized. Another factor that may be weighing on risk sentiment may investors adopting a cautious stance ahead of tomorrow’s FOMC monetary policy decision.
Global Equities Tumble On Evergrande's Growing Default Risks
The US dollar traded lower against most of the other major currencies on Monday and during the Asian session Tuesday. It gained only versus GBP, while it was found virtually unchanged against NZD. The main gainers were AUD, CHF and JPY.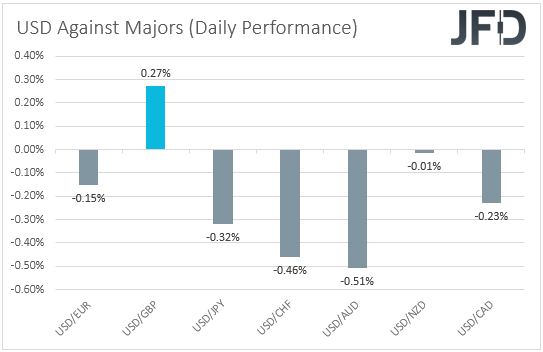
The weakening of the US dollar and the strengthening of the Aussie suggest that markets may have traded in a risk-on manner yesterday and today in Asia. However, the relative strength of the safe-havens yen and franc, combined with the weakening of the Kiwi and the pound, points otherwise. Thus, in order to get a clearer picture with regards to the broader market sentiment, we prefer to turn our gaze to the performance of the equity world. There, we see that major EU and US indices were a sea of red, with the negative appetite rolling into the Asian session today. Chinese and South Korea’s markets remained closed due to holidays.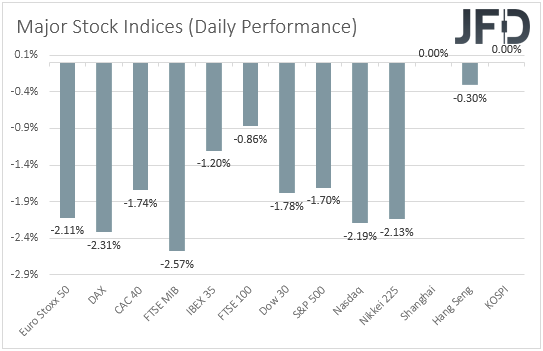
Many indices tumbled more than 2% yesterday, and the reason may have been warnings by Chinese regulators that Evergrande’s $305bn worth of liabilities could result in risks to the broader financial system if its debts are not stabilized. Evergrande, China’s most indebted developer, has to pay $83.5mn in interest relating to its March 2022 bond on Thursday, while it has another $47.5mn payment due on Sept. 29 for March 2024 notes. If it fails to settle the payments within 30 days of the scheduled dates, both bonds would default. With no signs of a possible solution on the horizon, we see the case for the default risks to continue growing and keep adding pressure to the broader risk appetite.
Another factor that may be weighing on risk sentiment may investors adopting a cautious stance ahead of tomorrow’s FOMC monetary policy decision. With several policymakers expressing desire to start tapering their QE purchases before the end of the year, it would be interesting to see whether such a view is shared among the majority of Committee members, and whether we will get any hints on when the process will start. Anything suggesting that tapering could start in November may result in a rebound in the US dollar, and further declines in equities. Earlier tapering may also mean earlier rate hikes, and higher rates mean expensive borrowing for firms, as well as lower present values.
The Kiwi failed to capitalize against the US dollar, as it came under some selling interest after the RBNZ published a speech by Assistant Governor Christian Hawkesby, saying that amid uncertainty, and when risks are evenly balanced, “central banks globally tend to follow a smoothed path and keep their policy rate unchanged or move in 25 basis-point increments.” This weighed on hopes of a 50 basis-point increase at the RBNZ’s upcoming gathering. In our view, such a reaction suggests that a 25bp hike is more than priced in and therefore, even if the Bank proceeds with such a move, it would need something beyond that to support the Kiwi, perhaps a steeper-than-anticipated future rate path.
NASDAQ 100 Technical Outlook
The NASDAQ 100 cash index fell sharply yesterday, but hit support at 14815 and then, it rebounded. Overall, the index remains below the prior upside support line drawn from the low of May 19, and thus, even if the latest rebound extends for a while more, we would consider the near-term picture to be negative.
As we already noted, we could see the latest recovery extending somewhat, but we see decent chances for the bears to take charge again from near the 15170 territory, which acted as a ceiling for the index between July 23 and Aug. 22. This could result in another slide and another test near the 14815 territory, or near the 14715 zone, defined as a support by the low of Aug.19. A break below that hurdle could carry more bearish implications, perhaps paving the way towards the low of July 19, at 14450.
Now, in order to start examining whether the outlook has turned back to positive, we would like to see a recovery above 15545, a barrier that prevented the index from moving higher last week. Such a break may open the path towards the all-time high, at around 15710, the break of which could allow advances towards the psychological round number of 16000.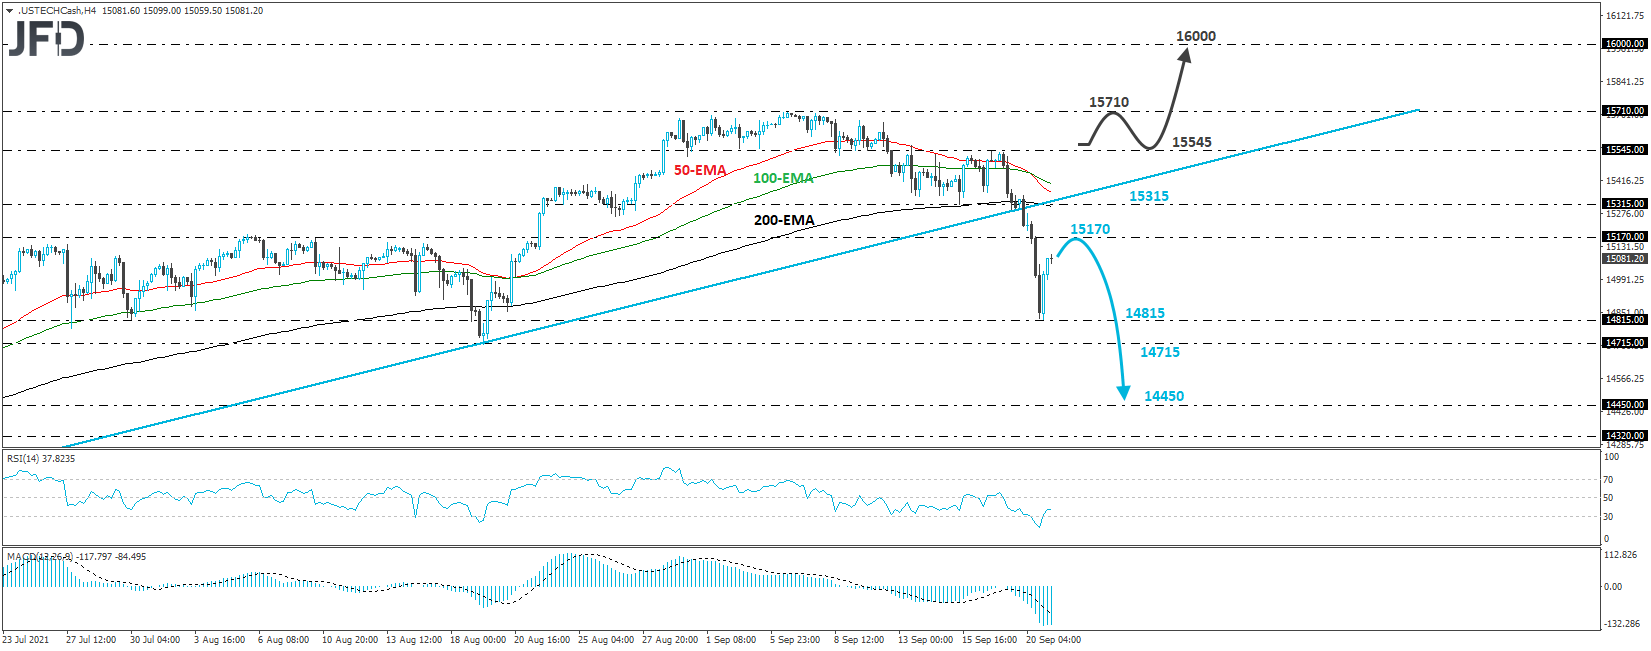
NZD/USDTechnical Outlook
NZD/USD has been trading in a consolidative manner since Friday, between the round number of 0.7000 and the 0.7042 barrier. Overall though, the price structure remains of lower highs and lower lows, with the dip below 0.7080 on Sept. 16 signaling a short-term bearish reversal. Therefore, we would see a negative short-term picture.
We could see the pair extending somewhat its small recovery, but the bears could jump back into the action from near the 0.7042 hurdle, which stands near the 200-EMA on the 4-hour chart. The forthcoming slide could result in a dip below 0.7000, but the move that would make us more confident on a bearish continuation is a dip below the 0.6985 zone, marked by the low of Aug. 30, and the inside swing high of Aug. 25. This could set the stage for declines towards the 0.6935 territory, which provided support to the pair between Aug. 24 and 27.
We will abandon the bearish case only if we see a rebound back above the 0.7080 zone. This will discard the aforementioned reversal and may pave the way towards the 0.7140 area, the break of which could target the peak of Sept.3, at 0.7170.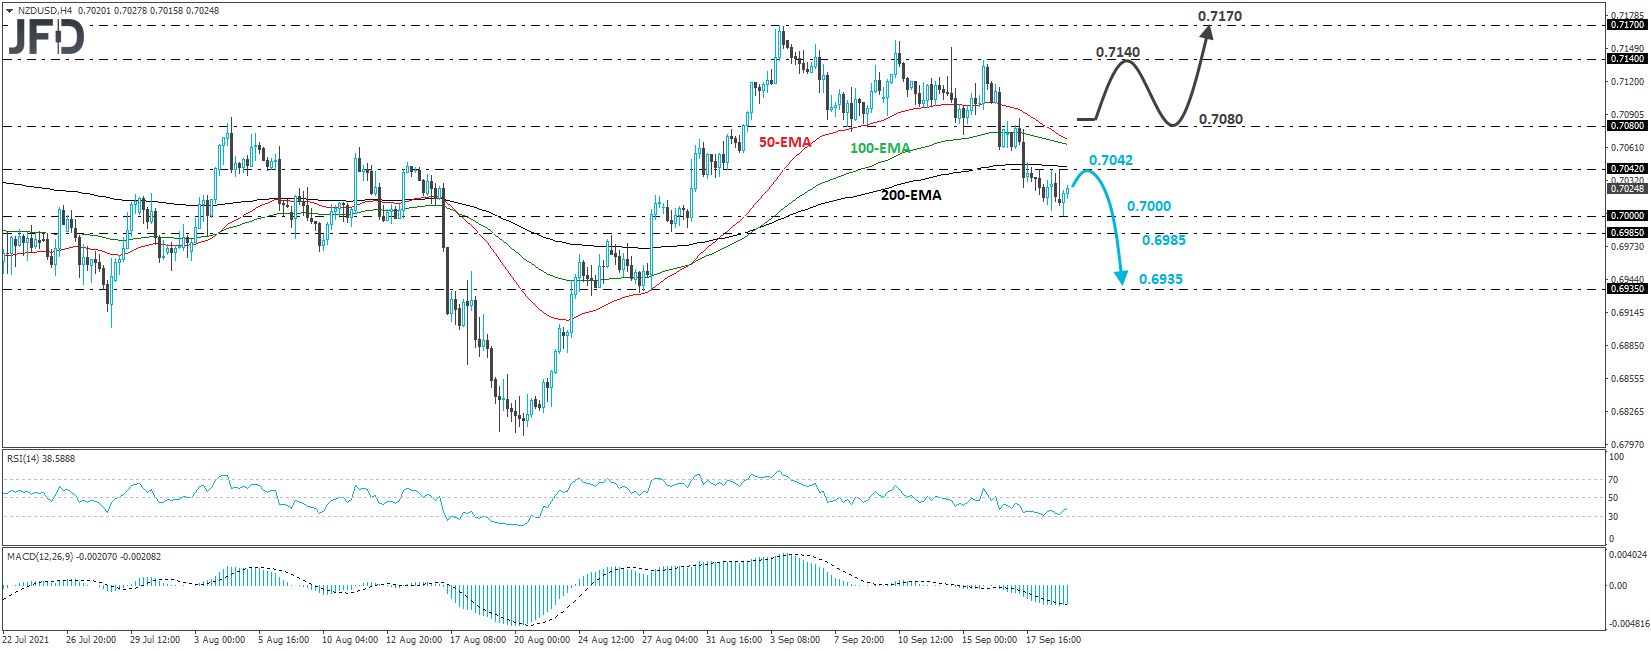
As For Today's Events
During the Asian session, the RBA released the minutes from its latest policy gathering, but as we have been anticipating, they passed largely unnoticed. There was no new information in the minutes. It was just confirmed that the central scenario remains that rate increases will not happen until 2024.
We also had the results of the Canadian elections, with Trudeau’s Liberal Party returning to power with a minority government. With the Parliament composition also expected to be nearly the same as before the election, we expect market participants to leave the event behind them and stay more focused on the Evergrande saga and developments surrounding monetary policy.
Later in the day, the only data releases worth mentioning are the US building permits and housing starts for August, as well as the API (American Petroleum Institute) report on crude oil inventories for last week. Building permits are forecast to have slid somewhat, but housing starts are expected to have inched slightly up. As for the API report, as it is always the case, no forecast is available.
As for the speakers, we have two on the agenda and those are: ECB President Christine Lagarde and ECB Supervisory Board Chair Andrea Enria.