Equities extend Friday’s losses
The war of words (so far) between the US and Iran escalated at the weekend, and this has taken its toll on global equity markets at the start of this week. US indices extended Friday’s losses by between 0.39% and 0.44% while the Australia200 index was the under-performer of the session with losses of 0.48%. Japanese markets reopened after an extended New Year holiday with losses of 0.30%.
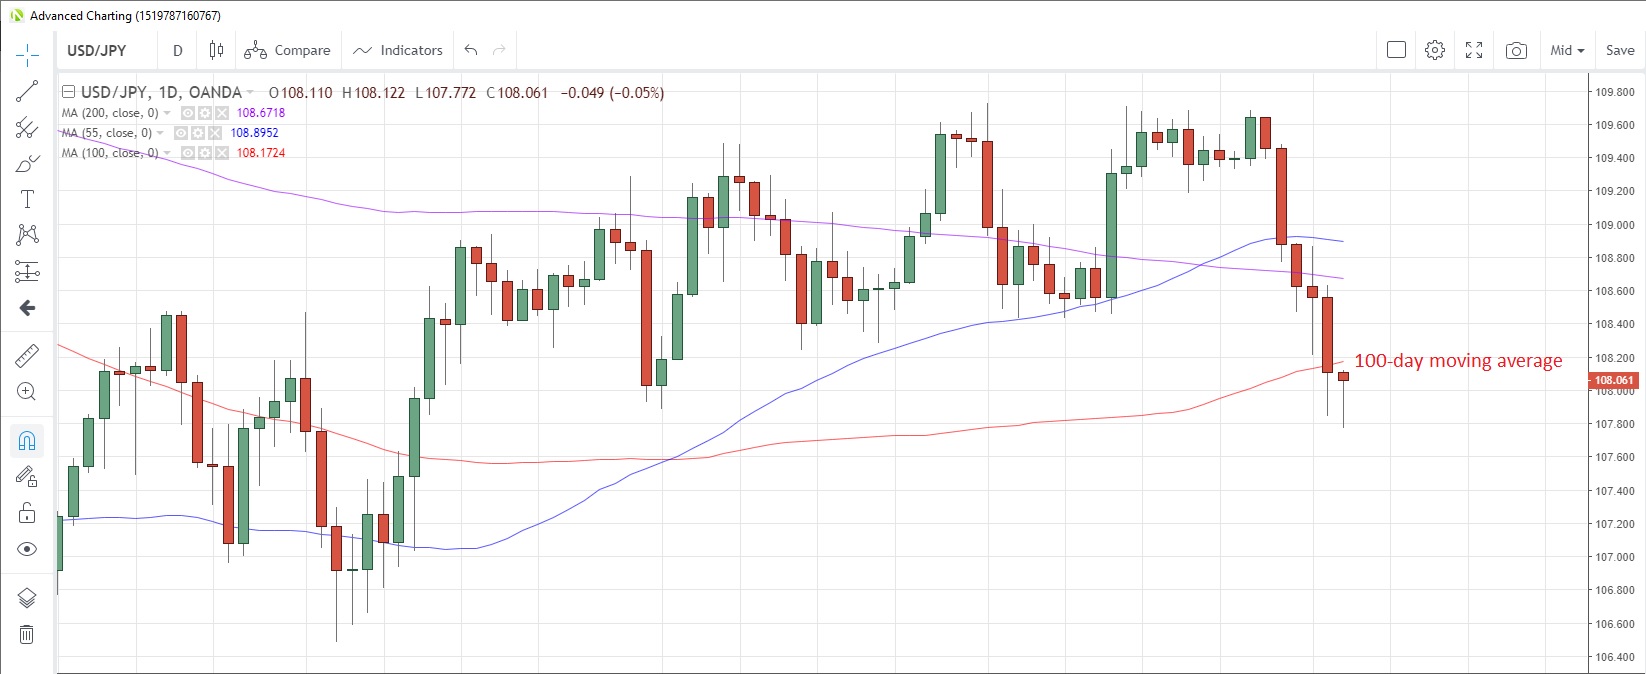
In contrast, currency markets were relatively calm with the Japanese yen out-performing amid safe-haven demand. USD/JPY fell for a sixth consecutive day, the longest stretch since December 2018, dropping 0.12% to 107.98. The pair opened below the 100-day moving average this morning, the first time since October 9.
USD/JPY Daily Chart

Other currency pairs were mixed but little-changed, with EUR/USD up 0.07% at 1.1166, GBP/USD up 0.06% at 1.3087 and AUD/USD slipping 0.02% to 0.6946. Oil prices jumped on supply disruption possibilities, with WTI surging to the highest in more than eight months.
Revenge for retaliation
US President Trump has been back on Twitter for the past few days, warning Iran that if it targets US assets as revenge for last week’s airstrike, the US has labeled 52 Iranian sites, including cultural and historic sites, which it will not hesitate in “hitting very fast and very hard”.
Iran in the meantime has said it will no longer adhere to the 2015 nuclear agreement signed with overseas powers and the limits on uranium enrichment and weapons stockpiling.
There appears to be no current solution to the standoff and the risk-off mood overhanging markets appears to be here to stay in the near term.
China services PMI slides
The Caixin services PMI fell to 52.5 in December, down from 53.5 in November but still above the 50 contraction/expansion threshold. The official China services PMI also showed a downward bias, data released on December 31 showed. That reading slid from 54.4 to 53.5, but has been steadily above 50 since March 2012.
In other data, released today, Hong Kong’s manufacturing PMI improved from a record low of 38.5 to 42.1 last month. Japan’s Jibun Bank manufacturing PMI slid to 48.4 from 48.8 in December.
Busy European calendar
The European session kicks off with German retail sales for December, which are expected to rise 1.0% m/m, a smart turnaround from November’s 1.9% decline and could imply that the German consumer was out in force spending ahead of Christmas.
Final Markit services PMIs from across the region are due today, including Germany, the Euro-zone and the UK. The final US reading is also due, with the first estimate suggesting an improvement to 52.2, the highest since August.
