As we move ever deeper into the holiday season, for traders and investors taking a week or two away from the screens it often takes some time to reorientate one’s view and pick up the threads of sentiment and risk which ultimately drive flows in all markets. But one of the quickest ways to view the current mood is to consider the two leading indicators of risk and sentiment, namely the VIX and the Japanese yen which reflect this in two different ways.
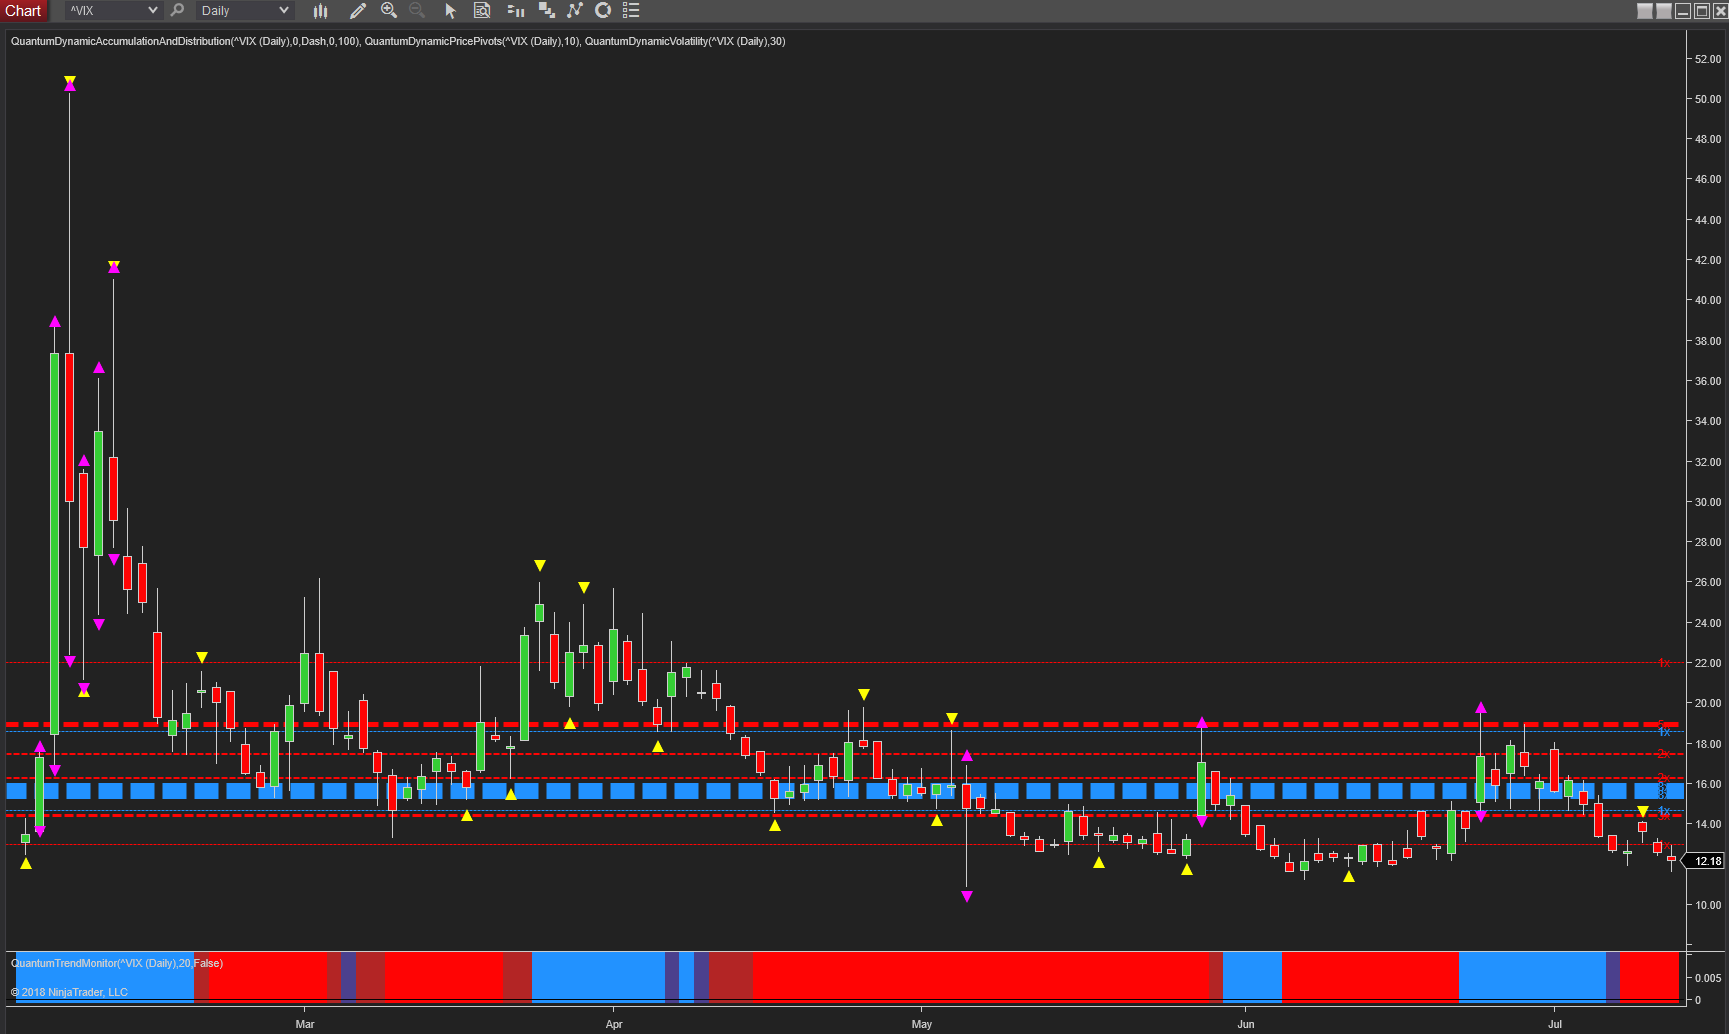
If we start with the daily chart for VIX, the extreme volatility of earlier in the year is once again subsiding, and rather like the aftereffects of an earthquake, continue to reverberate but with diminishing strength, with the most recent example occurring in late June as the VIX returned to test the strong resistance in the 19 area. Since then, the index in July has continued to move lower, and is now once again testing the platform of support in the 11.30 region having closed last week at 12.18 and with a bearish tone. This strong return of risk on sentiment, that is currently being driven by strong earnings has once again been led by the NQ which continues to move into new high ground, with the S&P 500 and the Dow 30 looking to regain the levels of early in the year, and should the VIX continue lower and breach the 11.22 area in due course, then this risk appetite will remain strong for the time being.

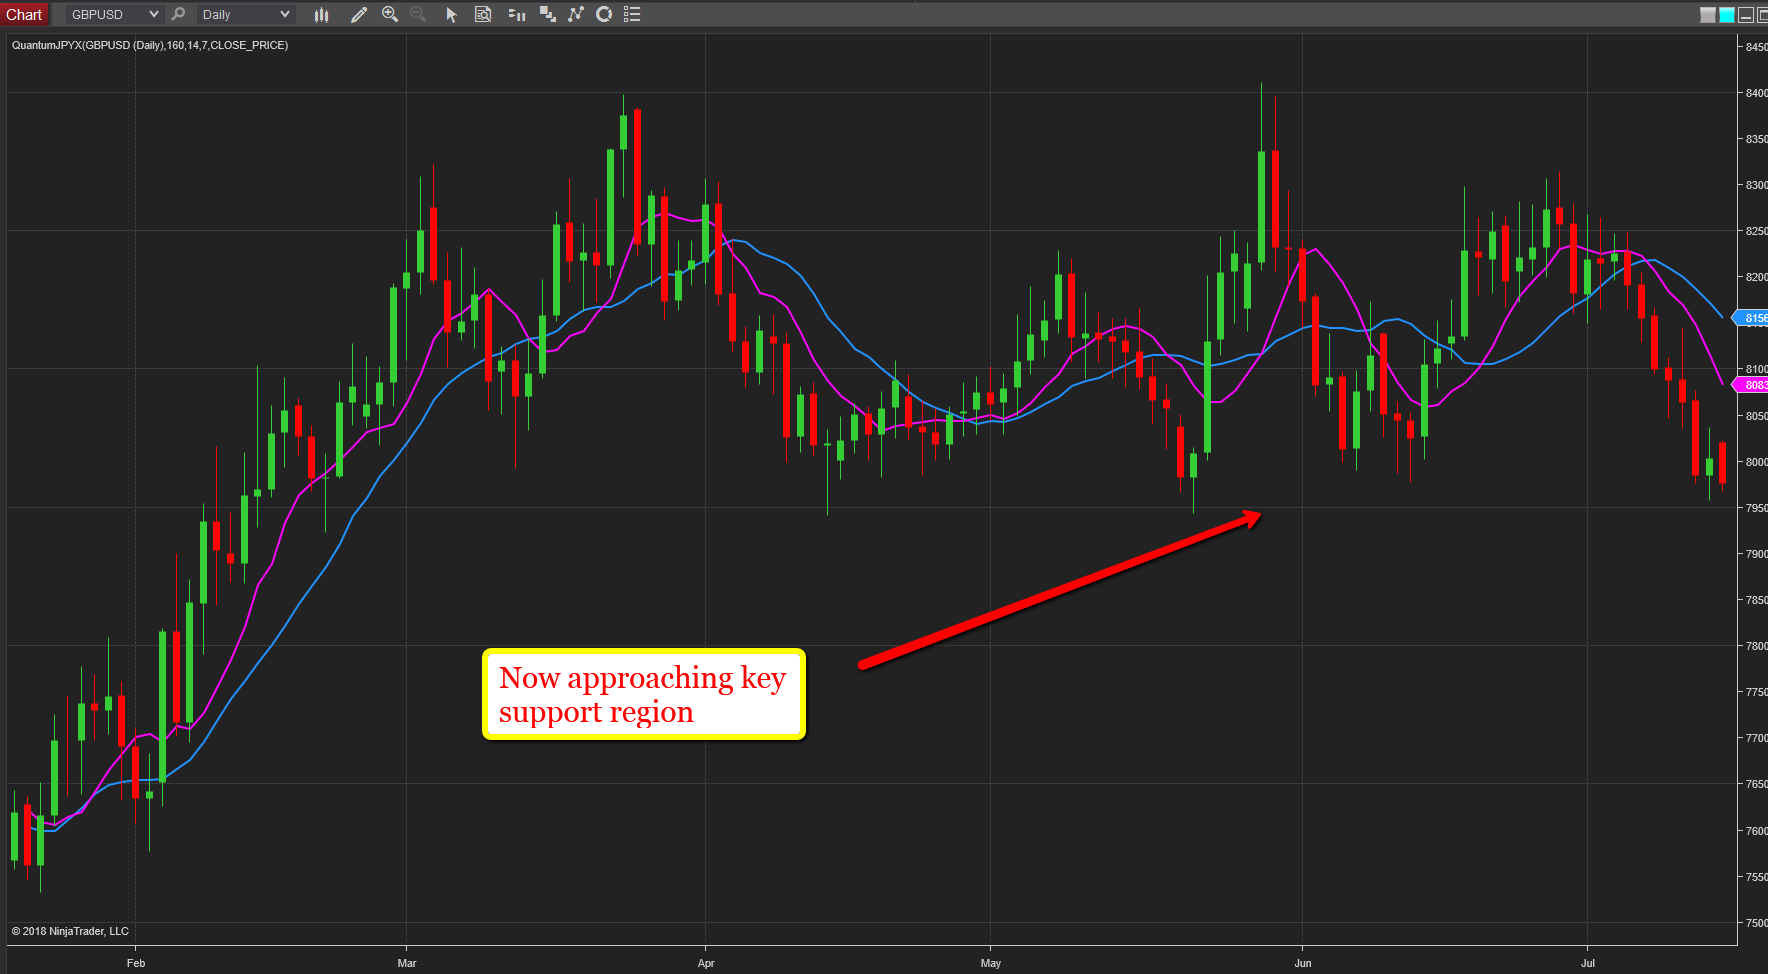
Moving to the daily chart for the yen index, this too reflects a similar picture with the yen falling steadily since the start of the month with only Friday’s price action punctuating the current bearish trend, as the 8000 level is once again under threat. The key level now is in the 7950 area which saw the index bounce higher earlier in the year, and most notably in both April and May, and sending a clear signal of the importance of this price region. Indeed since March, the index has oscillated in a longer term congestion phase with the ceiling of resistance around 8400, and the floor of support in the 8,000 area. Should the breakout occur to the downside, then this is likely to move lower and test the next level of potential support in the 7,750 thereby reaffirming the risk on sentiment now firmly in place with the yen complex generally marching in lockstep. The only laggard in this context is the NZD/JPY which continues to remain bearish on dovish comments from the RBNZ.
