After the Fed’s surprise move, the dust is settling. We are seeing serious reprising across many currency pairs with sharp movements practically anywhere you look. With the euro, the yen or the Canadian dollar?
It’s hard to choose a winner among all the moves in our favor. Let’s shine light onto every pair covered so that you are as prepared for what lies ahead.
EUR/USD: Reversing The Course
Thursday, we wrote the following:
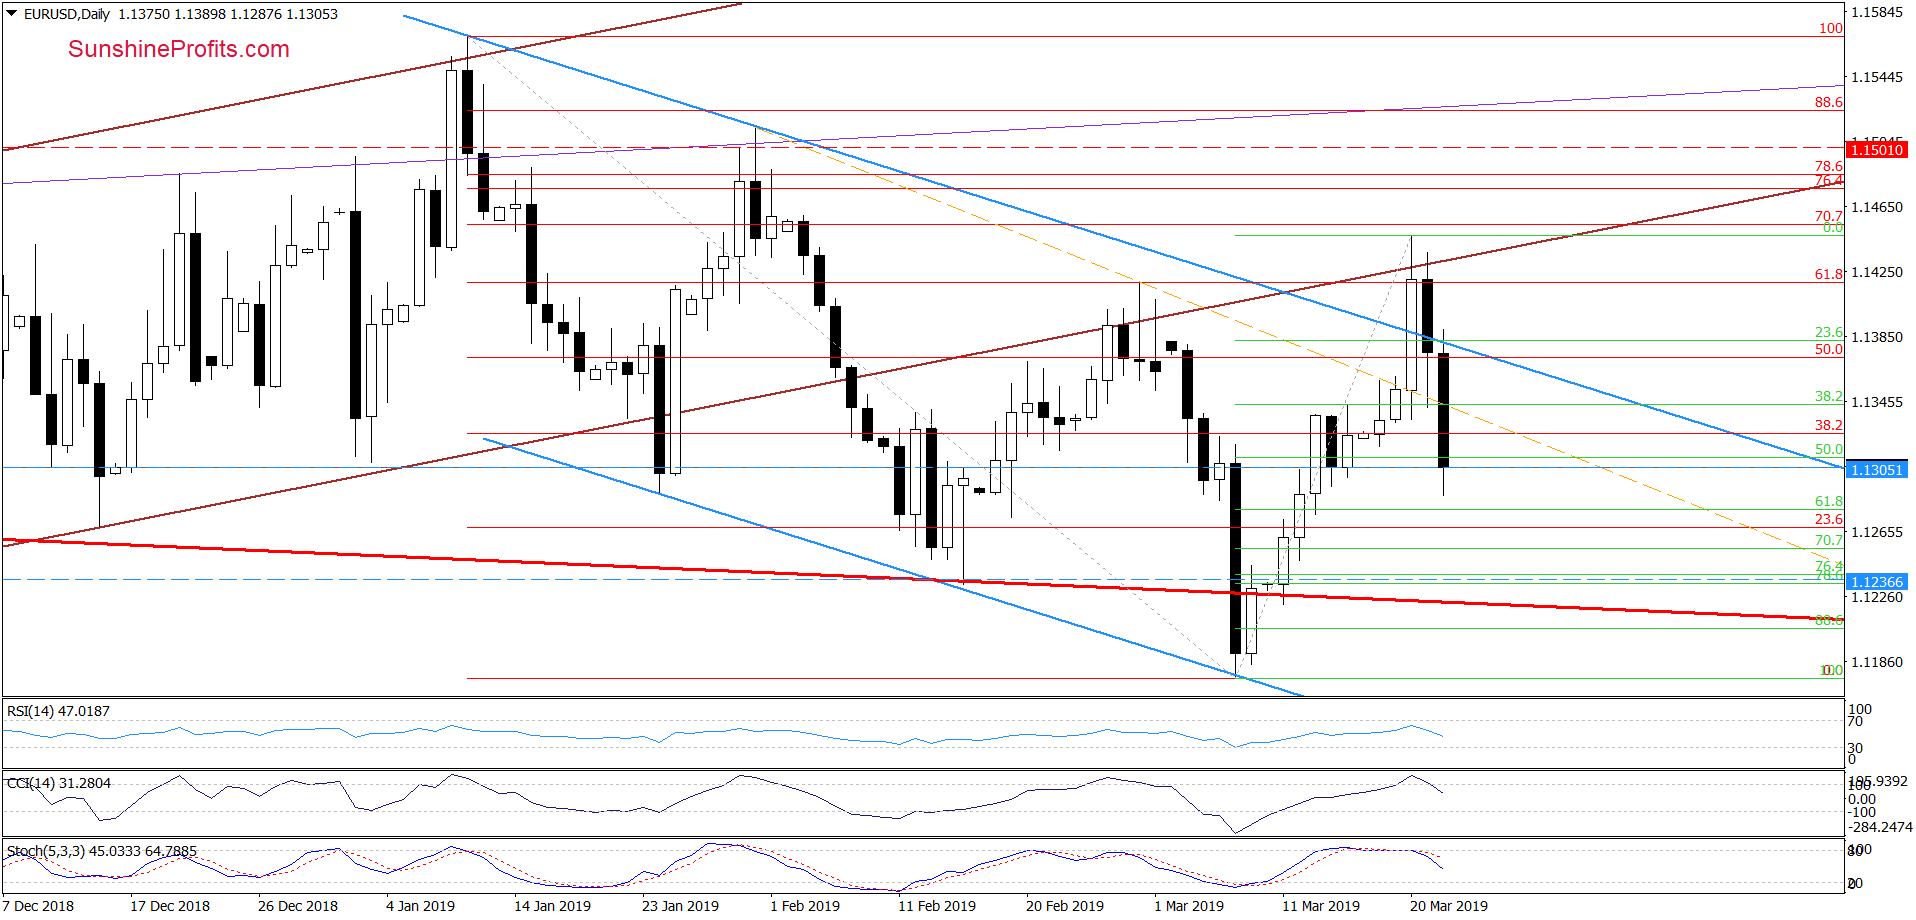
(…) the U.S. dollar moved sharply lower after the Fed monetary policy U-turn(…) this has pushed EUR/USD above the upper border of the blue declining trend channel.
The exchange rate also tested the previously-broken lower border of the brown rising trend channel, however the bulls have run out of steam before the closing bell. (…) the pair invalided the earlier tiny breakout (…) It’s similar to what we have seen at the end of February. Back then, the buyers struggled for several days before giving up on further breakout attempts.
(…) it suggests that reversal is just around the corner. Therefore, we believe that opening short positions is justified from the risk/reward perspective.
From today’s point of view, we see that the situation developed in tune with the above scenario. EUR/USD not only reversed, but also moved sharply lower during Thursday’s session.
The exchange rate slipped below the previously broken upper border of the blue declining trend channel and closed profoundly below it. On top of that, the CCI and Stochastic Oscillator generated their respective sell signals, encouraging the sellers to act more forcefully.
Early Friday, the bulls tried to take the pair higher, but failed. The result has been a verification of Thursday’s breakdown, followed by heavy selling. Weak German manufacturing and services PMI figures have been the catalyst.
As a result, EUR/USD moved even sharper lower Friday, making our short positions even more profitable. The pair reached our initial downside target, but taking into account the above-mentioned sell signals, breakdowns and size of recent candlesticks, we think that further deterioration still lies ahead.
If the situation develops in tune with this assumption, EUR/USD will extend losses and test next Fibonacci retracement or even the lower border of the long-term red declining trend channel (currently at around 1.1232) in the coming week.
USD/JPY: Breaking Down On Schedule
In Wednesday’s commentary on this currency pair, we wrote the following:
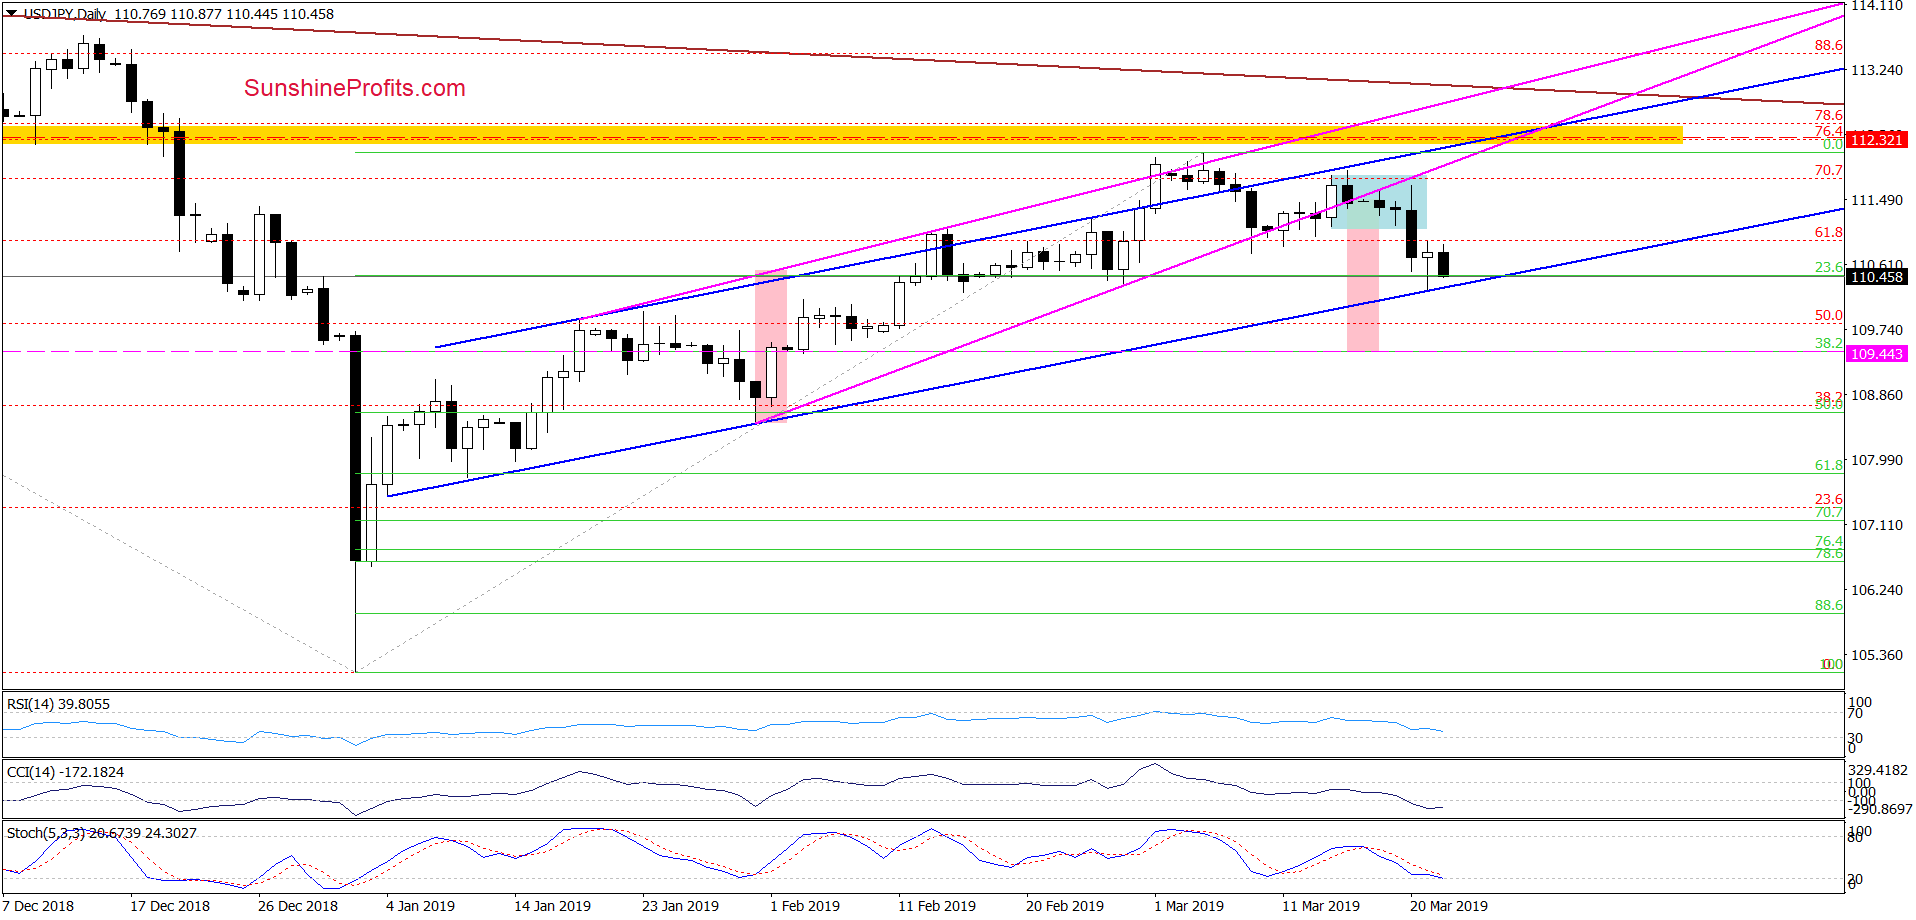
(…) the pair moved slightly higher earlier today, this upswing may turn out to be a verification of the above mentioned breakdown and also a test of the upper border of the consolidation.
Should the buyers fail in this area, the exchange rate will likely extend losses. The lower border of the blue rising trend channel (currently at around 110.19) is a primary retest candidate here (…)
Although currency bulls took the pair higher on Wednesday (in line with our expectations), they didn’t manage to break above the lower border of the pink rising wedge and the upper border of the blue consolidation. This show of weakness triggered a sharp decline till the end of the session, which resulted in a drop below the consolidation. The sideways trend has ended.
The pair reached our first downside target on Thursday, which triggered a small rebound. However, taking into account the fact that the sell signals remain in full force, we think that further deterioration is still ahead of us.
Nevertheless, lower values of USD/JPY will be more likely if the pair ends the week below the lower border of the blue rising trend channel. If we see such price action, the way to 109.44 (here, the size of the downward move would be equal to the height of the pink rising wedge) will be open.
USD/CAD: Rebounding Like Clockwork
Quoting our Wednesday alert:
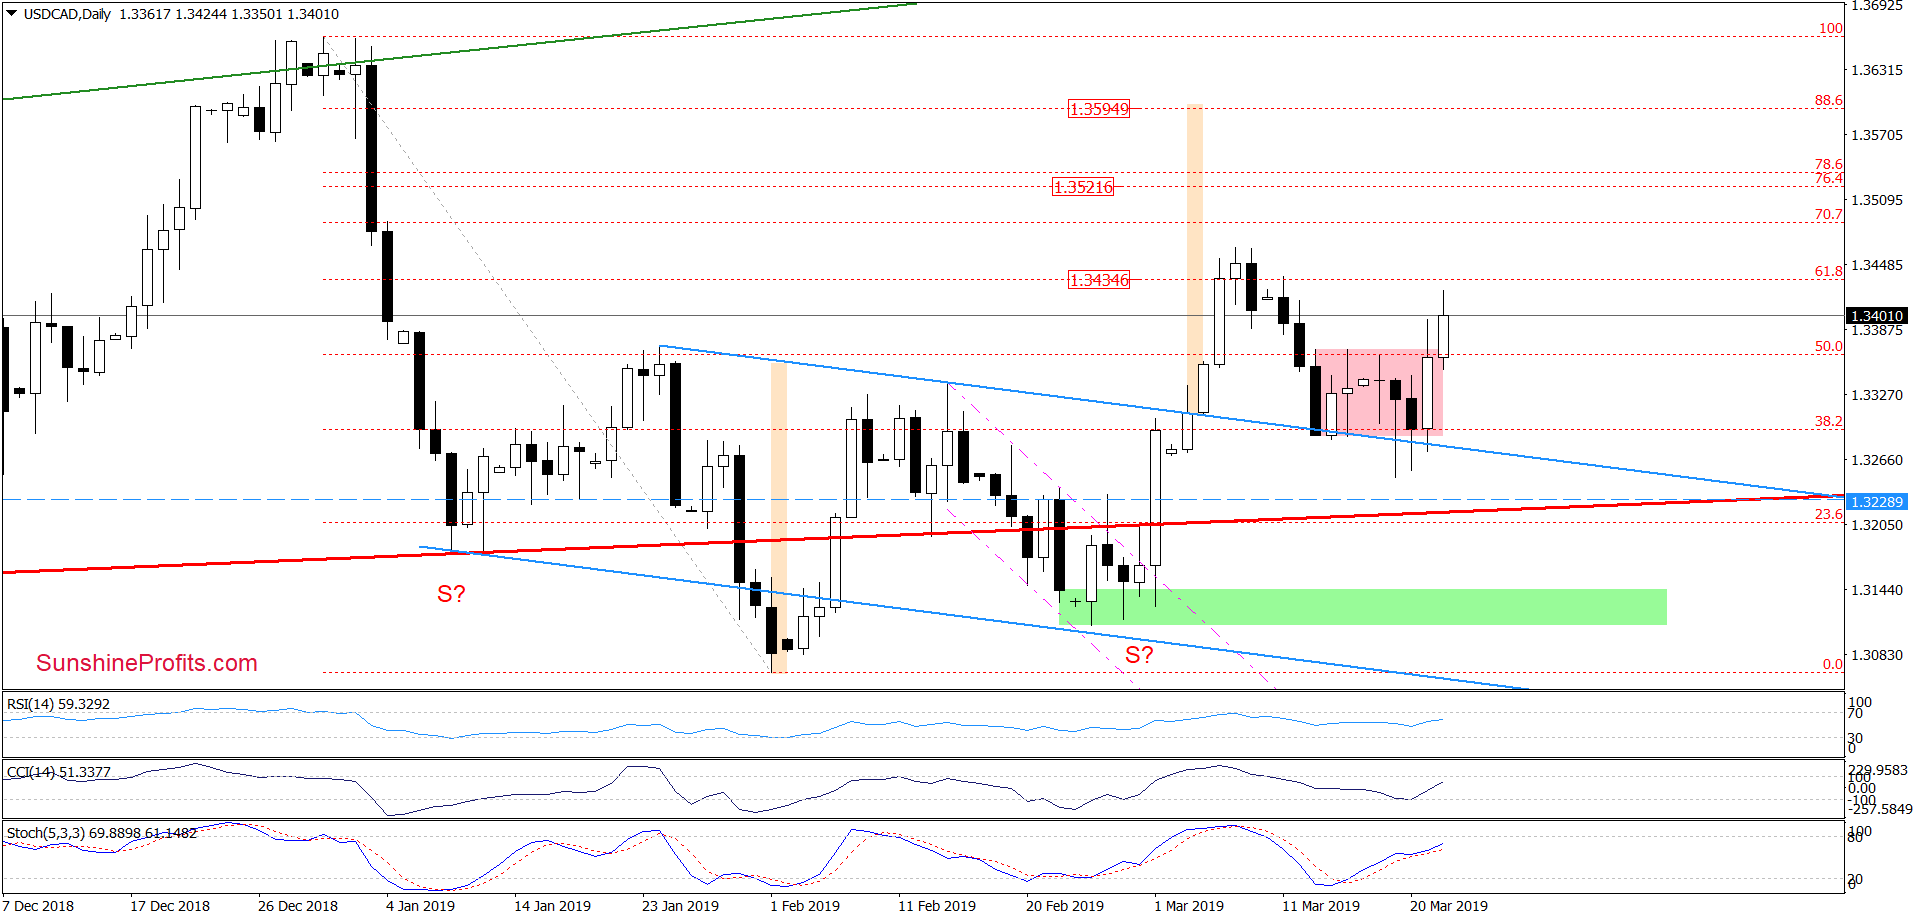
(…) After retesting the previously broken upper border of the blue declining trend channel, the pair reverted back into the consolidation.
This way, the attempted breakdown below the consolidation was invalidated and can bring further improvement in the following days – especially when we factor in the buy signals generated by the daily indicators. If this is indeed the case, the first upside target will be the upper border of the pink consolidation, and if it is broken, the journey to the March peaks can follow.
Looking at the daily chart, we see that the bulls took USD/CAD to our first upside target during Thursday’s session. This show of strength emboldened buyers to follow up early Friday, which suggests that we’ll see a realization of Wednesday’s scenario in the coming days.
Thank you.


