Wednesday March 28: Five things the markets are talking about
Global equities are trading on the back foot, with tech and mining names leading the charge lower.
Yesterday stateside, US tech shares suffered their worst drop in over a month on concerns over trade tensions, motivated by President Donald Trump’s protectionist moves.
Trump's latest plan to punish China for violations of US’s intellectual-property rights has the White House administration pondering a crackdown on Chinese investments in technologies that the US considers sensitive.
Amid the risk-off trading environment, US Treasuries have extended their price gains, pushing yields to seven-week lows. In currencies, the yen (¥105.52) has slipped while the pound (£1.4172) fluctuates as the market waits for signs of progress on the problem of the Irish border after Brexit.
On tap: After this morning’s US final GDP reading (08:30 am EDT), US personal income and spending data for February are due to be released on Thursday (08:30 am EDT). In Europe, German March preliminary CPI data will be released tomorrow, while France delivers on Friday.
1. Tech stocks see red
Japanese stocks fell overnight, led by a sell-off in tech firms, while ex-dividend trades added to the broader losses. The Nikkei share average closed out -1.3% lower, while the broader TOPIX dropped -1%.
Down-under, Aussie shares skidded overnight, mirroring Wall Street’s fall. At the close of trade, the S&P/ASX 200 index was down -0.7% – the same percentage it added on in its previous session. In South Korea, the KOSPI stock index weakened on Wednesday, falling -1.3% at the close.
In Hong Kong, stocks fell to their lowest closing level in three-weeks, amid renewed fears of a Sino/US trade war. The Hang Seng index fell -2.5%, the lowest closing level since March 5. The China Enterprises Index lost -2.4%.
In China, equities were guilty by association, with tech firms hit hard on concerns over tighter government scrutiny on the industry. At the close, the Shanghai Composite index was down -1.4%, while the blue-chip CSI300 index closed down -1.8%.
US stocks look set to open in the ‘red’ (-0.3%).
Indices: STOXX 600 -1.3% at 362.8, FTSE 100 -1.1% at 6924, DAX -1.7% at 11772, CAC 40 -1.5% at 5040, IBEX 35 -1.2% at 9364, FTSE MIB -1.3% at 21935, SMI -1.2% at 8534, S&P 500 Futures -0.3%

2. Oil prices fall on surprise US inventory rise, gold higher
Oil prices trade under pressure, pulled down by a US report of increasing crude inventories.
Brent crude futures are at +$69.69 per barrel, down -42c, or -0.6%, while US WTI crude futures are at +$64.72 a barrel, down -53c, or -0.8% percent, from yesterday’s close.
US API data late Tuesday reported a surprise +5.3m barrels rise in crude stocks in the week to March 23, to +430.6m barrels.
Note: US oil production has already jumped by almost a quarter since mid-2016, to +10.4m bpd, taking it past top exporter Saudi Arabia and within reach of the biggest producer, Russia, which pumps around +11m bpd.
Expect investors to take their cues from today’s official US API inventory print (10:30 am EDT).
Note: OPEC said to be looking for long-term cooperation with non-OPEC members. Reports circulated yesterday that the Saudi Crown Prince Mohammed bin Salman was looking to reach a +10 to 20-year supply agreement with Russia and other producers.
Ahead of the US open, gold prices have edged a tad higher overnight, supported by a ‘soft’ish’ dollar, a day after the yellow metal recorded its biggest one-day percentage fall in nearly two-weeks as a US/China trade spat worries eased. Spot gold is up +0.2% at +$1,346.96 per ounce.
Note: The yellow metals prices dropped -0.6% on Tuesday, their biggest one-day percentage decline since March 15.

3. Sovereign yields fall to multi-week lows
Narrow ranges across Bunds and most Euro and US spreads amid lower volumes, despite the US ‘s record supply, suggest that the fixed income market has already entered Easter mode.
Note: In total and by week’s end, the US Treasury will have auctioned approximately +$294B of bills and notes, its largest slate of supply ever.
Ahead of the US open, the yield on 10-year US Treasuries has dipped -2 bps to +2.76%, the lowest in more than seven-weeks. In the UK, the 10-year Gilt yield has declined -5 bps to +1.371%, the lowest in two-months, while in Germany, the 10-year Bund yield has dipped -2 bps to +0.48%, reaching the lowest in 11-weeks on its fifth straight decline.
Elsewhere, the Bank of Thailand (BoT) left interest rates unchanged overnight as it awaits more signs of a broad-based recovery in the economy and monitors developments in US policy that could hurt global trade. Officials kept its one-day repurchase rate at +1.5%. One member of the seven-person committee voted to raise the rate by +0.25%.

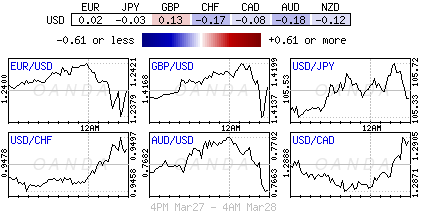
4. Dollar confined to trading ranges
The ‘mighty’ dollar remains well contained within its 2018 trading range.
The EUR/USD (€1.2393) continues to hover atop of the psychological €1.2400 handle ahead of some key Euro inflation data in coming sessions. EU inflation is not making it easy for ECB officials to begin its ‘normalization’ process. Of late, a number of ECB members (Praet and Liikanen) have cautioned against premature tightening.
Note: German March preliminary CPI data will be released tomorrow, while France delivers on Friday. The advance Euro-Zone CPI is set for release next week (April 4).
GBP/USD (£1.4150) continues to fail to hold onto gains above the key psychological £1.4200 level. Initial pound strength stemmed from reports that UK was to offer a Brexit “hard Irish border” resolution imminently, with details beyond just the so-called backstop plan.
Safe-haven flows are failing to support yen (¥105.69) as the market focuses on some de-escalation of Korean peninsula tensions. North Korea leader Kim Jong-Un stated that his country was willing to hold dialogue with US.
Elsewhere, SEK (€10.2986) has slide to an 8-year low against the EUR due to market expectations that the Riksbank may postpone hiking interest rates until next-year on worries about the Swedish housing market as house prices continue to fall.

5. Some positives in stalled NZ business sentiment
While New Zealand’s overall business confidence weakened slightly in March, as gloom continues in the agricultural sector, there are positives in yesterday’s ANZ business outlook survey.
Digging deeper, a net +12% of companies are expecting to increase investment, up from +7% in February, and employment and export intentions also improved.
Companies also expect profits to increase by +6% compared with a slight fall expected just a month ago.
Nevertheless, the overall index did slip to -20 from -19 as the recovery from a post-election slide in sentiment stalls for now.