This article has already been saved in your Saved Items
USD/JPY
-0.08%
Add to/Remove from Watchlist
Add to Watchlist
Add Position
Position added successfully to:
NDX
-0.57%
Add to/Remove from Watchlist
Add to Watchlist
Add Position
Position added successfully to:
JP225
-2.53%
Add to/Remove from Watchlist
Add to Watchlist
Add Position
Position added successfully to:
HK50
-0.99%
Add to/Remove from Watchlist
Add to Watchlist
Add Position
Position added successfully to:
LCO
-0.51%
Add to/Remove from Watchlist
Add to Watchlist
Add Position
Position added successfully to:
CL
-0.47%
Add to/Remove from Watchlist
Add to Watchlist
Add Position
Position added successfully to:
SSEC
-0.29%
Add to/Remove from Watchlist
Add to Watchlist
Add Position
Position added successfully to:
DXY
-0.06%
Add to/Remove from Watchlist
Add to Watchlist
Add Position
Position added successfully to:
Risk appetite eased somewhat during the US session yesterday, and the Asian trading today, as both infected cases and deaths due to the coronavirus spreading returned into acceleration mode, with deaths hitting a new daily record. The slide in oil prices may have also contributed in easing investors’ risk appetite. Both Brent and WTI slid yesterday, as the API reported the biggest gain in inventories since January 2017.
CORONAVIRUS CASES AND DEATHS ACCELERATE AGAIN
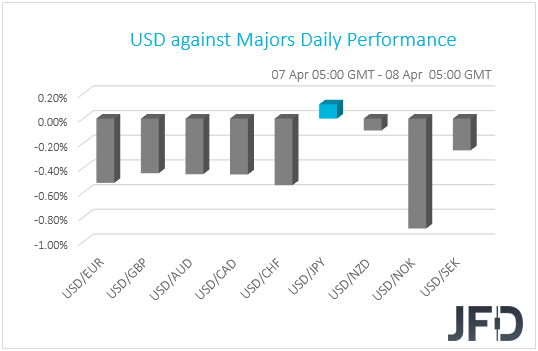
The dollar traded lower against all but one of the other G10 currencies on Tuesday and during the Asian morning Wednesday. It lost the most ground against NOK, CHF and EUR, while it eked out some gains only against JPY.
USD performance G10 currencies
The weakening of both the dollar and the yen suggests another day of risk-on trading, but the strengthening of the franc points otherwise. Thus, bearing in mind that the FX performance paints a blurry picture with regards to the broader investor morale, we will turn our gaze to the equity world.
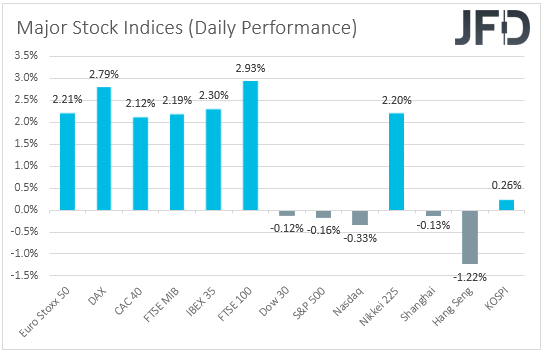
There EU shares continued rallying for a second straight day, perhaps as investors continued cheering early signs that the coronavirus spreading is levelling off. Wall Street indices also opened higher, but eventually slid to close slightly in negative waters. The subdued appetite rolled over into the Asian session today as well. Although Japan’s Nikkei gained 2.30%, at the time of writing, China’s Shanghai Composite and Hong Kong’s Hang Seng are down 0.13% and 1.22%, respectively.
Major global stock indices performance
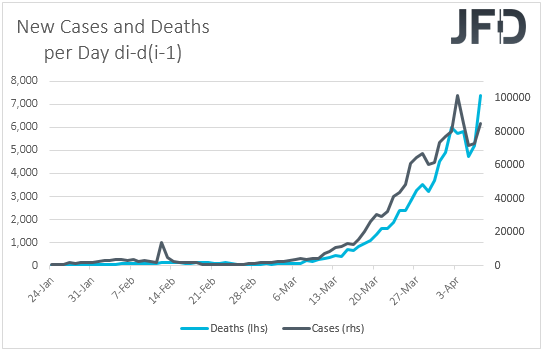
What may have put the brakes on market participants’ enthusiasm may have been the acceleration in new infected cases and deaths due to the coronavirus spreading, with deaths reaching a new daily record. Although New York Governor Andrew Cuomo said that the state is nearing a plateau in the number of hospitalized patients, new deaths in the state were 731, the highest within a day since the pandemic’s outbreak. In Spain, deaths accelerated as well, for the first time in five days.
Coronavirus new cases and deaths on a day by day basis
The slide in oil prices may have also contributed in easing investors’ risk appetite. Both Brent and WTI slid 3.57% and 9.39% yesterday, as the API (American Petroleum Institute) reported the largest weekly gain in crude oil inventories since January 2017. Anxiety over whether major oil producers will reach an output-cut deal tomorrow may have also been a reason. Now, focus for oil traders shifts to the EIA (Energy Information Administration) weekly report, due out today, where a confirmation of a spike in output may keep oil prices under pressure. However, the big determinant with regards to the black gold’s upcoming direction may be the outcome of the OPEC+ meeting that ends tomorrow. It would be very important to see whether producers will eventually find common ground and if so, whether the new cuts will be enough to offset the tumble in global demand due to the pandemic outbreak.
Back to the virus saga, even if we get another rebound in equities, we will stay reluctant to trust a long-lasting recovery. Remember, yesterday morning we noted that it was too early to call for a peak in the spreading of the coronavirus, and the latest acceleration makes us even more cautious. What’s more, with officials across the EU pushing forward with plans to start lifting restrictive measures, we see the risk for the virus to start spreading at an even faster pace. In our view, it is too early to call off the lockdowns. We believe that they should be extended for a while more in order to ensure that the virus has indeed been contained. In any case, we stick to our guns that the global economy may start recovering well after the peak of the pandemic, as people may be hesitant getting out of their homes, even after we get free movement permissions.
USD/JPY – TECHNICAL OUTLOOK
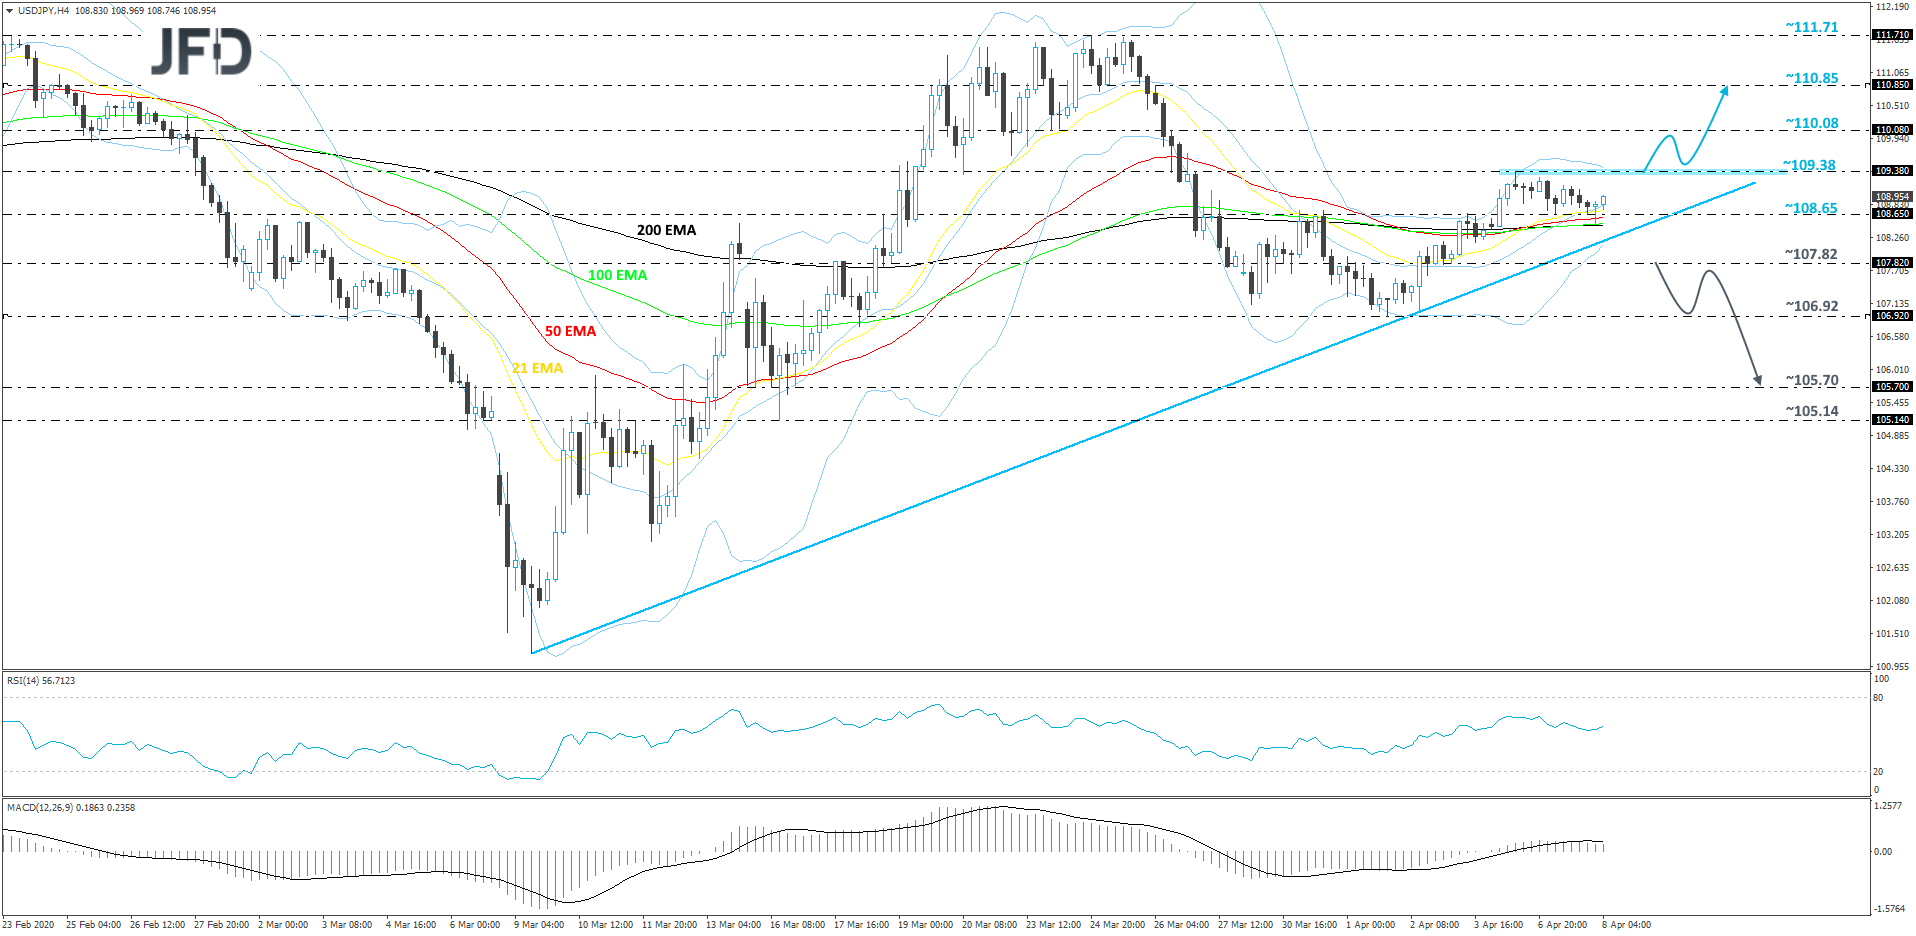
From the beginning of this week, USD/JPY has been moving sideways, roughly between the 108.65 and 109.38 levels. Overall, the pair remains above a short-term tentative upside support line drawn from the low of March 9th. In order to get comfortable with higher areas, we would like to see a break above the 109.38 barrier, which is the current high of this week. Until then, we will remain cautiously-bullish, considering the fact that USD/JPY stays above the upside line.
As mentioned above, if the pair does get a good push from the bulls and climbs above the 109.38 barrier, this would confirm a forthcoming higher high and more buyers may join in. That’s when USD/JPY might end up targeting the 110.08 obstacle, a break of which could set the stage for a move to the 110.85 level. That level is marked by an intraday swing high of March 26th and near the low of March 25th.
Alternatively, if the aforementioned upside line breaks and the rate slides below the 107.82 hurdle, which is the low of April 3rd, this could spook a few bulls from the field, allowing the pair to drift further south. USD/JPY could then test its key support zone, at 106.92, marked by the current lowest point of April. Initially, that area may hold the rate strongly, possibly leading to a small rebound. However, if the bears are still feeling a bit stronger, another push lower might overcome the 106.92 zone this time and aim for the 105.70 level. That level marks an intraday swing low of March 16th. Slightly below it lies another potential support area, at 105.14, which is the low of the same day.
USD/JPY 4-hour chart technical analysis
NASDAQ 100 – TECHNICAL OUTLOOK
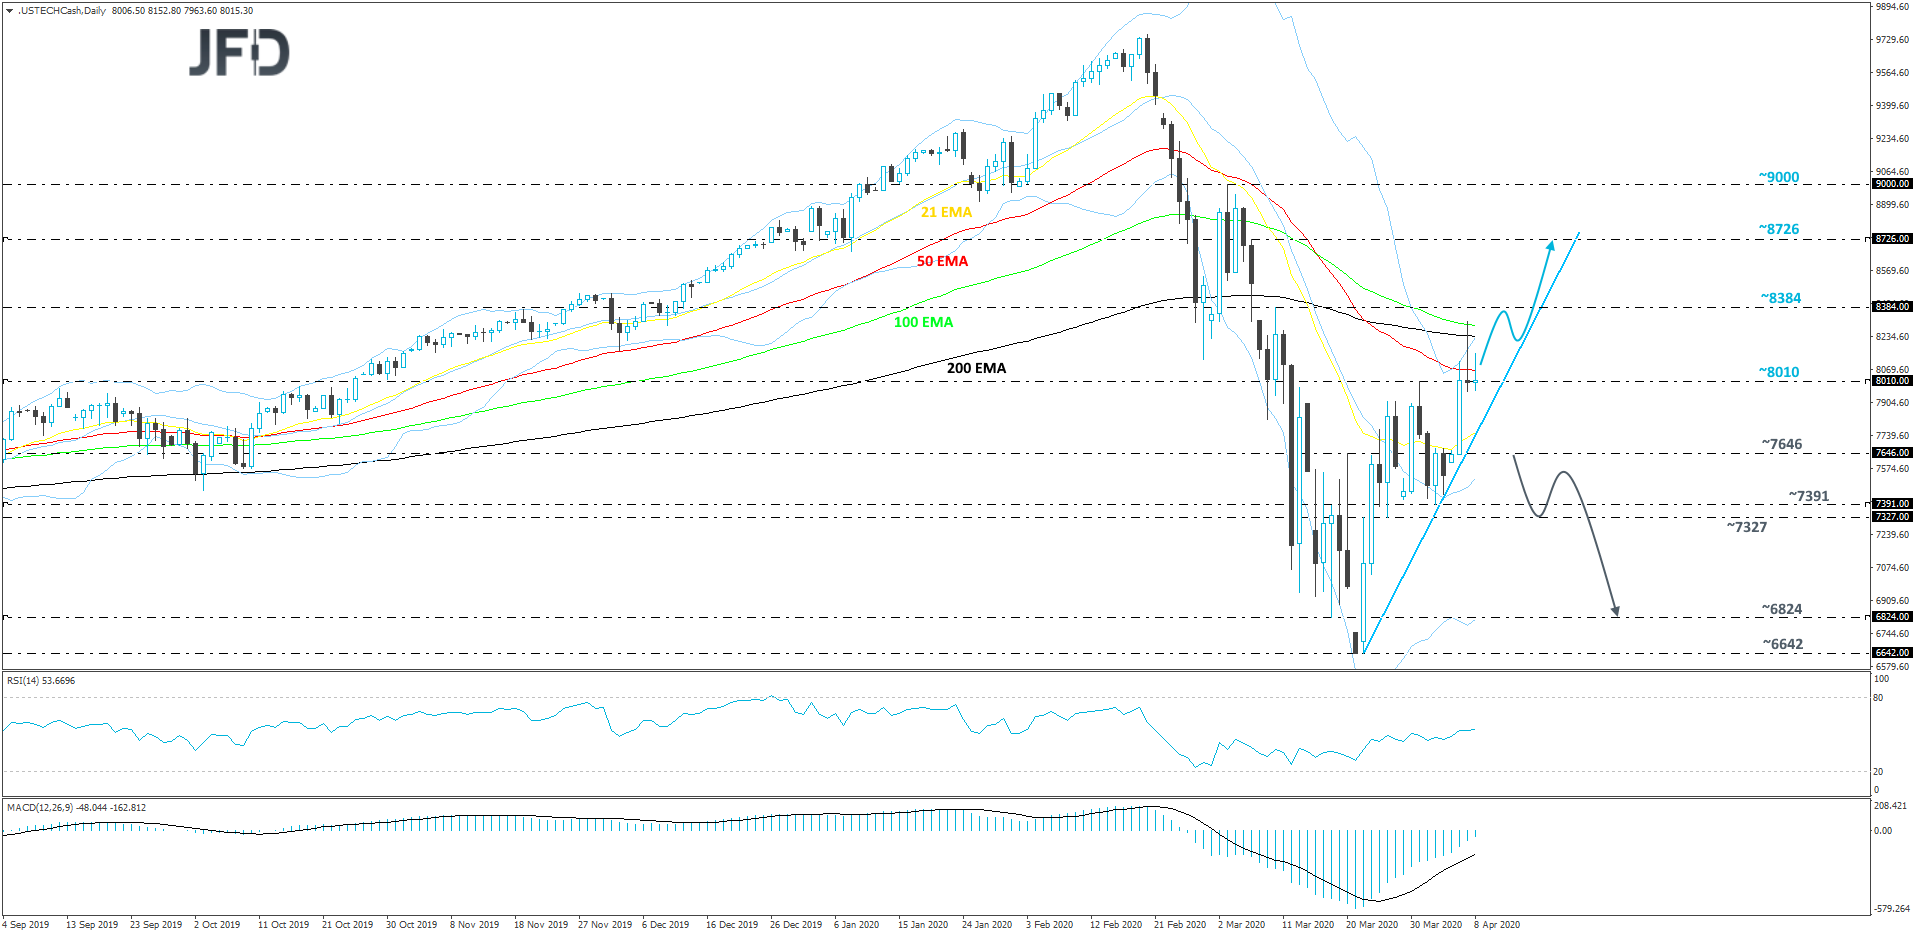
Although Nasdaq 100 closed fractionally in the red yesterday, it still remained above its short-term tentative upside support line taken from the low of March 23rd. The index also managed to stay above the psychological 8000 mark, which still gives a bit of hope for the buyers. This morning, we are seeing that the cash index is trying to make its way up again, however it is struggling with the 50 EMA on our daily chart. That said, as long as the price continues to balance above the aforementioned upside line, we will stick to the cautiously-bullish approach.
A further push north, above the 50-day EMA could increase the chances for Nasdaq 100 to drift to the 8384 barrier, marked by the high of March 10th. The price may stall there temporarily, or even correct slightly lower. That said, as mentioned previously, if the index remains above that upside line, we will continue examining opportunities for some more upside. If this time the 8384 hurdle surrenders and breaks, the next possible resistance level might be at 8726, marked by the high of March 6th.
Alternatively, if the previously-mentioned upside line breaks and the price falls below the 7645 hurdle, this could attract a few more sellers into the game. The index might then drift to the support zone between the 7327 and 7391 level, marked by the lows of March 26th and April 2nd respectively. The Nasdaq 100 could stall there for a bit, but if the selling continues, a break of that territory would open the door for a potential move to the 6824 area, which is the low of March 18th.
Nasdaq 100 cash index daily chart technical analysis
AS FOR THE REST OF TODAY’S EVENTS
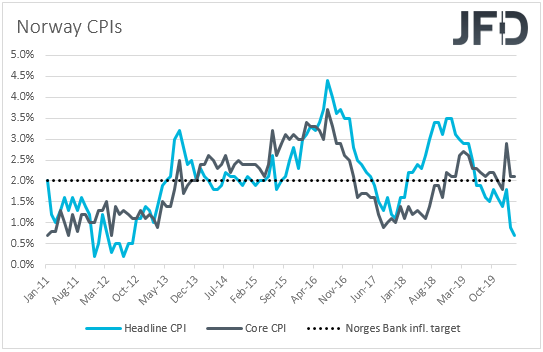
Although the Norwegian stock market is closed, during the early European morning we already got the nation’s CPIs for March. The headline rate declined to +0.7% yoy from +0.9% yoy, while the core rate remained unchanged at +2.1% yoy. The Norwegian Krone, which was yesterday’s main gainer, barely reacted to the data, as it appears that they are unlikely to alter Norwegian policymakers’ view around monetary policy. On March 19th, at an extraordinary meeting, the Norges Bank decided to reduce its policy rate to 0.25%, and noted that the Committee does not rule out further reductions. Norway’s economy depends largely on oil exports and if the lockdowns and restrictive measures around the globe continue to hurt demand for the black gold, officials may not hesitate to bring interest rates down to zero at their next ordinary meeting, scheduled for May 6th and 7th. After all, the effects of low oil prices are clearly visible on consumer prices. Although the core rate stands a tick above the Norges Bank’s inflation target, the headline one, which includes prices of energy items, is much lower.
Norway CPIs inflation
Later in the day, the FOMC releases the minutes of their second extraordinary meeting, held on March 15th, when officials decided to reduce the Federal funds target range by 100bps, to 0-0.25%. Having said that, we expect the minutes to pass unnoticed, as investors may treat them as outdated. Since then, the Fed already proceeded with additional measures in order to ease the economic damages from the fast spreading of the coronavirus, while on March 26th, Fed Chair Jerome Powell said that the Fed still has room for more policy action and that they are not going to run out of ammunition. We believe that market participants may stay on guard for tomorrow’s initial jobless claims for the week ended on April 3rd
As for other data released today, Canada releases its housing starts and building permits for March and February respectively. Housing starts are expected to have declined to 180k in March from 210.1k in February, while building permits are anticipated to have fallen 4.5% after rising 4.0% in January.
Disclaimer:The content we produce does not constitute investment advice or investment recommendation (should not be considered as such) and does not in any way constitute an invitation to acquire any financial instrument or product. The Group of Companies of JFD, its affiliates, agents, directors, officers or employees are not liable for any damages that may be caused by individual comments or statements by JFD analysts and assumes no liability with respect to the completeness and correctness of the content presented. The investor is solely responsible for the risk of his investment decisions. Accordingly, you should seek, if you consider appropriate, relevant independent professional advice on the investment considered. The analyses and comments presented do not include any consideration of your personal investment objectives, financial circumstances or needs. The content has not been prepared in accordance with the legal requirements for financial analyses and must therefore be viewed by the reader as marketing information. JFD prohibits the duplication or publication without explicit approval. 72.99% of the retail investor accounts lose money when trading CFDs with this provider. You should consider whether you can afford to take the high risk of losing your money. Please read the full Risk Disclosure - https://www.jfdbrokers.com/en/legal/risk-disclosure .
Risk Appetite Eases Somewhat As Virus Spreading Accelerates
Oil and gold jumped on rising geopolitical tensions after Israel struck targets in western Iran as a response to last weekend’s attacks. One of the concerned cities is...
The only aspect of consistency in the market’s outlook for rate cuts lately has been pushing the expected date forward. Recent history falls in line with this trend and...
Gold, franc, yen and oil spike higher after Israel strikes IranBut gains are pared after retaliatory response seen to be limitedStocks head deeper into the red after disappointing...
Risk Appetite Eases Somewhat As Virus Spreading Accelerates
Add a Comment
Comment Guidelines
We encourage you to use comments to engage with other users, share your perspective and ask questions of authors and each other. However, in order to maintain the high level of discourse we’ve all come to value and expect, please keep the following criteria in mind:
Enrichthe conversation, don’t trash it.
Stay focused and on track. Only post material that’s relevant to the topic being discussed.
Be respectful. Even negative opinions can be framed positively and diplomatically. Avoid profanity, slander or personal attacks directed at an author or another user. Racism, sexism and other forms of discrimination will not be tolerated.
Use standard writing style. Include punctuation and upper and lower cases. Comments that are written in all caps and contain excessive use of symbols will be removed.
NOTE: Spam and/or promotional messages and comments containing links will be removed. Phone numbers, email addresses, links to personal or business websites, Skype/Telegram/WhatsApp etc. addresses (including links to groups) will also be removed; self-promotional material or business-related solicitations or PR (ie, contact me for signals/advice etc.), and/or any other comment that contains personal contact specifcs or advertising will be removed as well. In addition, any of the above-mentioned violations may result in suspension of your account.
Doxxing. We do not allow any sharing of private or personal contact or other information about any individual or organization. This will result in immediate suspension of the commentor and his or her account.
Don’t monopolize the conversation. We appreciate passion and conviction, but we also strongly believe in giving everyone a chance to air their point of view. Therefore, in addition to civil interaction, we expect commenters to offer their opinions succinctly and thoughtfully, but not so repeatedly that others are annoyed or offended. If we receive complaints about individuals who take over a thread or forum, we reserve the right to ban them from the site, without recourse.
Only English comments will be allowed.
Any comment you publish, together with your investing.com profile, will be public on investing.com and may be indexed and available through third party search engines, such as Google.
Perpetrators of spam or abuse will be deleted from the site and prohibited from future registration at Investing.com’s discretion.
Your ability to comment is currently suspended due to negative user reports. Your status will be reviewed by our moderators.
Please wait a minute before you try to comment again.
Thanks for your comment. Please note that all comments are pending until approved by our moderators. It may therefore take some time before it appears on our website.


Add a Comment
We encourage you to use comments to engage with other users, share your perspective and ask questions of authors and each other. However, in order to maintain the high level of discourse we’ve all come to value and expect, please keep the following criteria in mind:
Enrich the conversation, don’t trash it.
Stay focused and on track. Only post material that’s relevant to the topic being discussed.
Be respectful. Even negative opinions can be framed positively and diplomatically. Avoid profanity, slander or personal attacks directed at an author or another user. Racism, sexism and other forms of discrimination will not be tolerated.
Perpetrators of spam or abuse will be deleted from the site and prohibited from future registration at Investing.com’s discretion.