Get 40% Off
🚨 Volatile Markets? Find Hidden Gems for Serious OutperformanceFind Stocks Now

Richmond Fed Manufacturing: Weakening Activity In April

Published 04/25/2018, 02:16 AM
Updated 07/09/2023, 06:31 AM

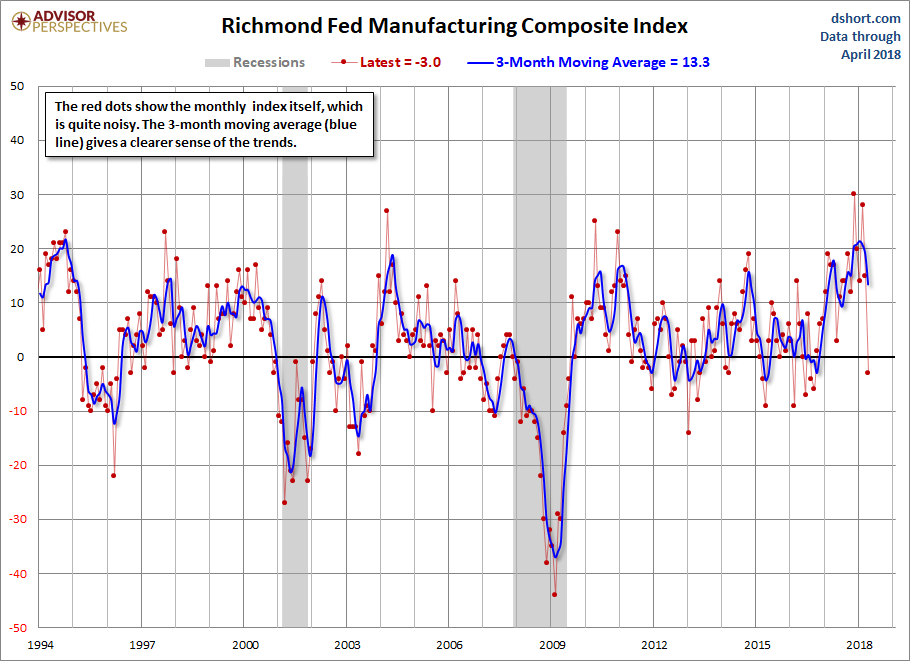
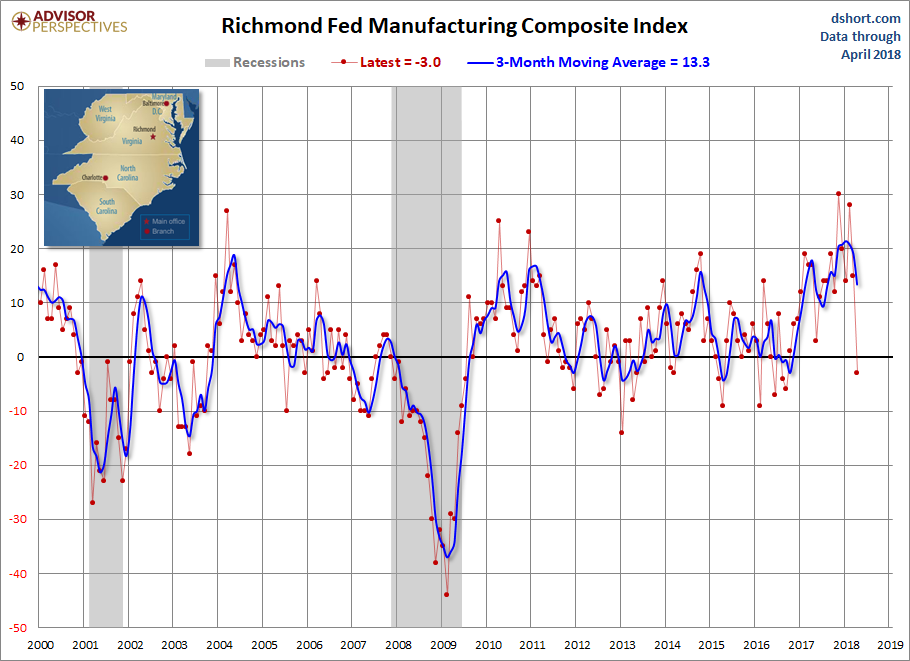
Today, the Richmond Fed Manufacturing Composite Index was at -3 for the month of March, down from last month's 15. Investing.com had forecast 16. Because of the highly volatile nature of this index, we include a 3-month moving average to facilitate the identification of trends, now at 13.3, which indicates expansion. The complete data series behind today's Richmond Fed manufacturing report, which dates from November 1993, is available here.

Here is a snapshot of the complete Richmond Fed Manufacturing Composite series.
Richmond Fed Manufacturing

Here is the latest Richmond Fed Manufacturing overview:

Results of the most recent survey from the Richmond Fed suggest that Fifth District manufacturing activity slowed in April. The composite index dropped sharply from 15 in March to −3 in April, its first negative reading since September 2016. The index was weighed down by a contraction in shipments and new orders; however, its third component, employment, rose slightly and remained in expansionary territory. The negative reading of the local business conditions index also suggested worsening conditions for District manufacturers, but surveyed firms were generally optimistic that they would see overall growth in the next six months. Link to Report

Here is a somewhat closer look at the index since the turn of the century.
Richmond Fed Manufacturing Composite Index

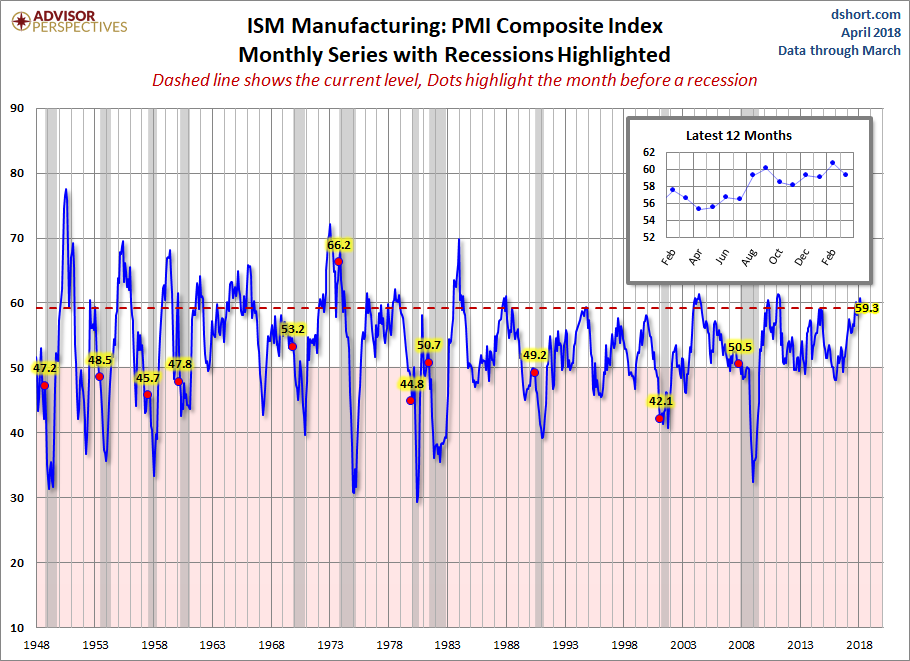
Is today's Richmond composite a clue of what to expect in the next PMI composite? We'll find out when the next ISM Manufacturing survey is released (below).
ISM Manufacturing

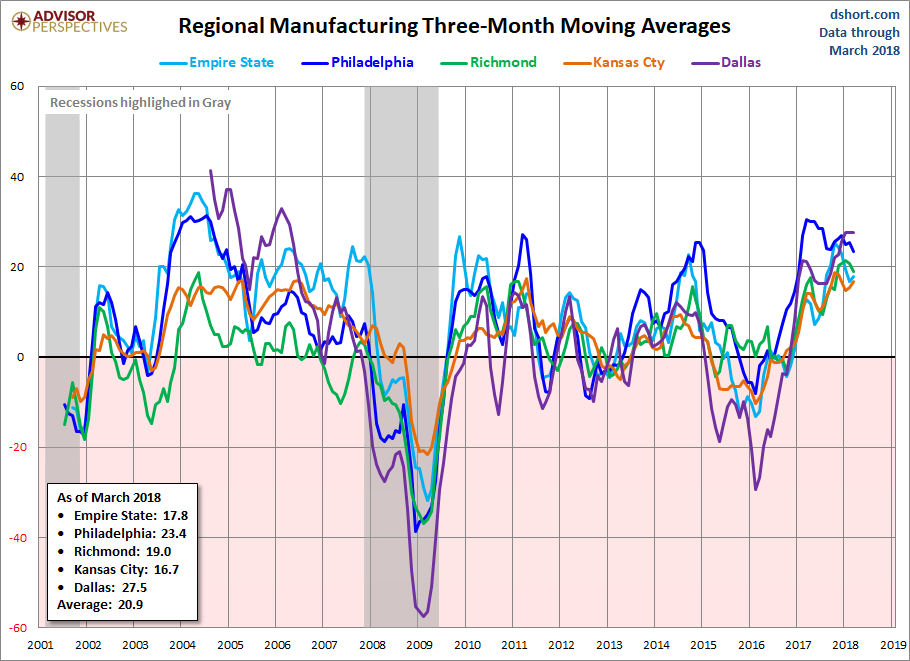
Let's compare all five Regional Manufacturing indicators. Here is a three-month moving average overlay of each since 2001 (for those with data).
3rd party Ad. Not an offer or recommendation by Investing.com. See disclosure here or remove ads .

Regional Manufacturing Three-Month Movinng Averages

Here is the same chart including the average of the five.
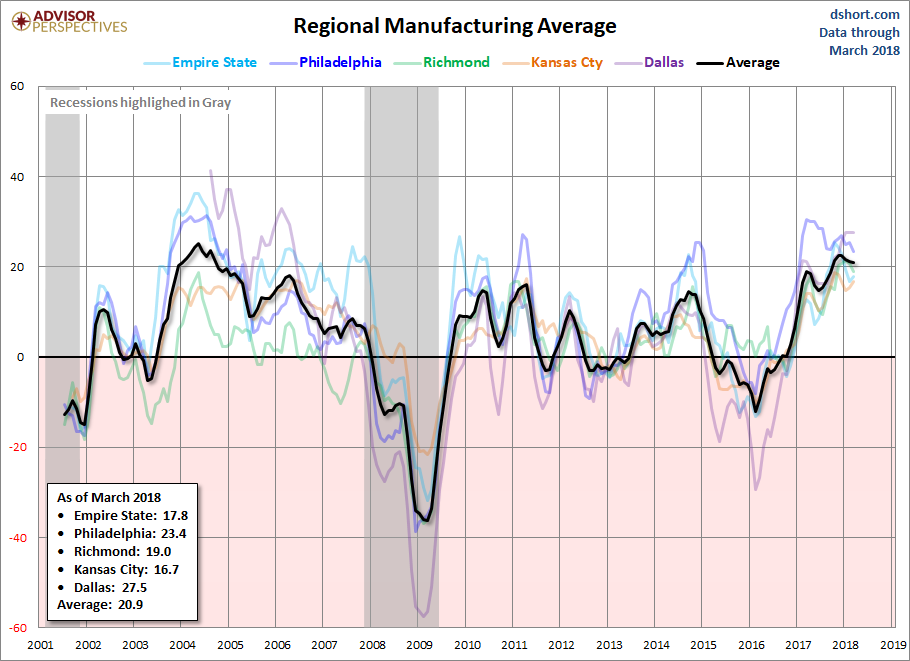
Regional Manufacturing Average

Original post

Latest comments

Risk Disclosure: Trading in financial instruments and/or cryptocurrencies involves high risks including the risk of losing some, or all, of your investment amount, and may not be suitable for all investors. Prices of cryptocurrencies are extremely volatile and may be affected by external factors such as financial, regulatory or political events. Trading on margin increases the financial risks.
Before deciding to trade in financial instrument or cryptocurrencies you should be fully informed of the risks and costs associated with trading the financial markets, carefully consider your investment objectives, level of experience, and risk appetite, and seek professional advice where needed.
Fusion Media would like to remind you that the data contained in this website is not necessarily real-time nor accurate. The data and prices on the website are not necessarily provided by any market or exchange, but may be provided by market makers, and so prices may not be accurate and may differ from the actual price at any given market, meaning prices are indicative and not appropriate for trading purposes. Fusion Media and any provider of the data contained in this website will not accept liability for any loss or damage as a result of your trading, or your reliance on the information contained within this website.
It is prohibited to use, store, reproduce, display, modify, transmit or distribute the data contained in this website without the explicit prior written permission of Fusion Media and/or the data provider. All intellectual property rights are reserved by the providers and/or the exchange providing the data contained in this website.
Fusion Media may be compensated by the advertisers that appear on the website, based on your interaction with the advertisements or advertisers.
© 2007-2024 - Fusion Media Limited. All Rights Reserved.