Being an equity bear has been brutal for, oh, nearly eight years now. With the S&P 500 up about 250% since bottoming in March 2009, equities have been, on the whole, raging higher, with some sectors in particular benefiting tremendously from the Trumpgasm. One area, though, seems to be recognizing a bitterly cold chill of reality, and that is retail.
Not everything retail is weak, of course, Amazon (NASDAQ:AMZN) has had an astonishing run (and we’ll see if it holds together when they report next week), and some stocks such as AutoZone Inc (NYSE:AZO) and O'Reilly Automotive Inc (NASDAQ:ORLY) have cranked out multi-hundred percent gains for years now. But many retail companies, particularly those having to do with clothing, have been getting whacked. Take, for instance, Abercrombie & Fitch Company (NYSE:ANF), which I’ve picked on endlessly: it is actually lower than it was at the greatest depths of the financial crisis. For how many stocks could you make that statement?
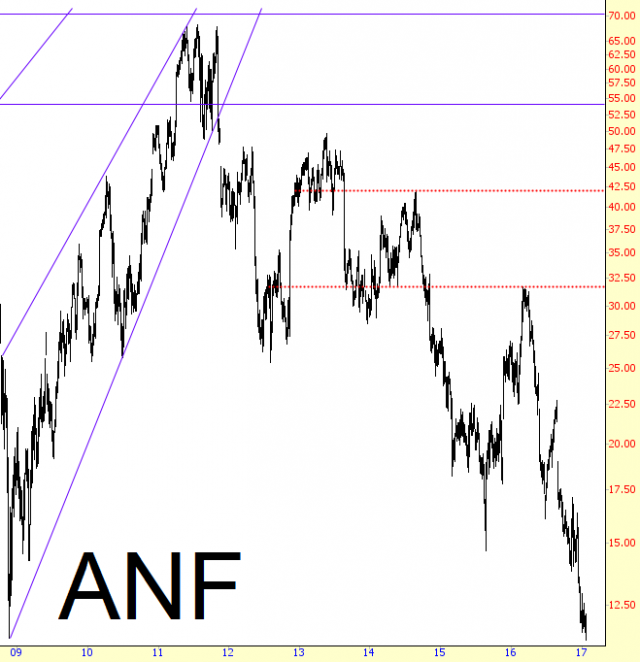
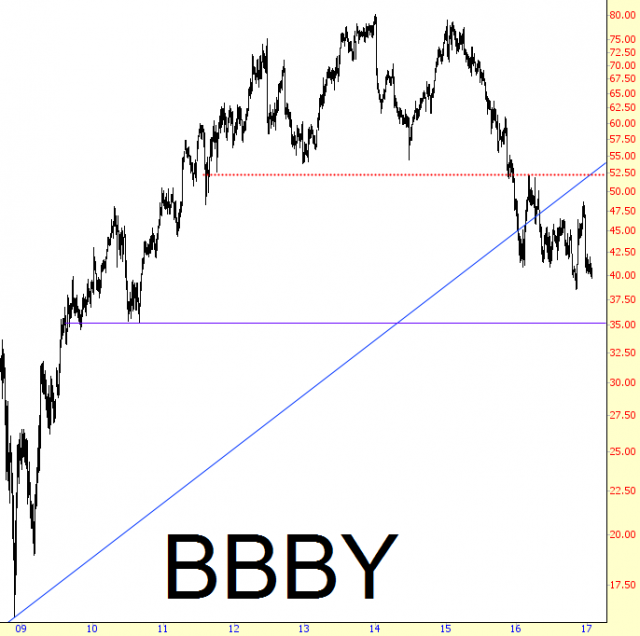
Bed Bath & Beyond (NASDAQ:BBBY) has a quite well-formed head and shoulders pattern (whose neckline is shown with a red horizontal below) that suggests much lower prices to come.
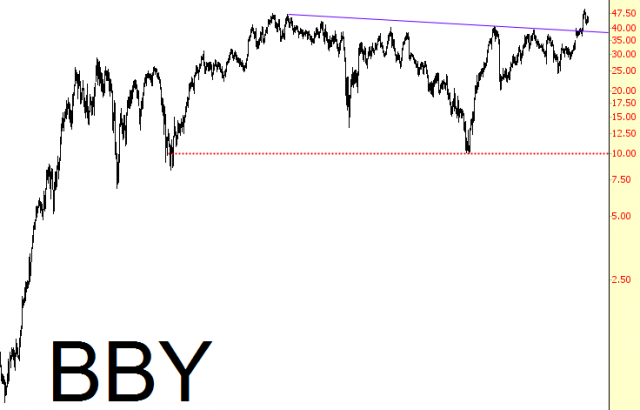
Be careful not to confuse this with a very similar symbol, however – Best Buy Co Inc (NYSE:BBY) – which, competition from Amazon be damned, is defying gravity and broke above resistance this year.
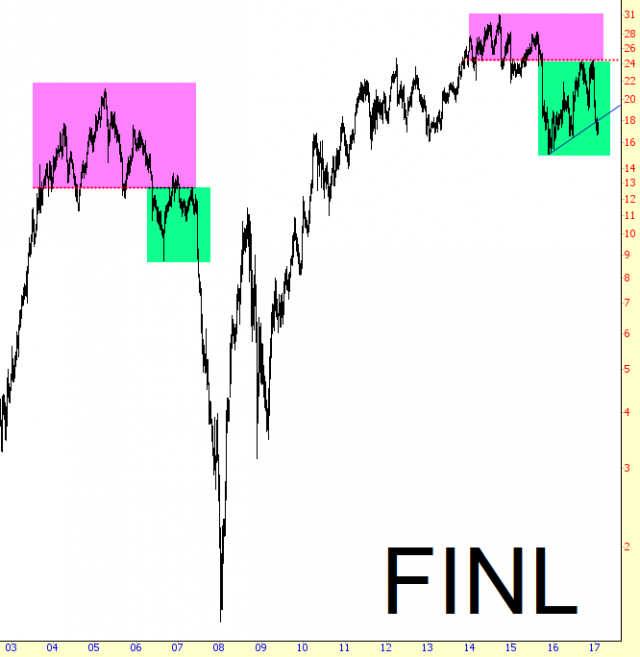
Let’s get back to the bearish charts, though: Shoe retailer The Finish Line Inc (NASDAQ:FINL) has been trending lower for months, and the analog is going beautifully:
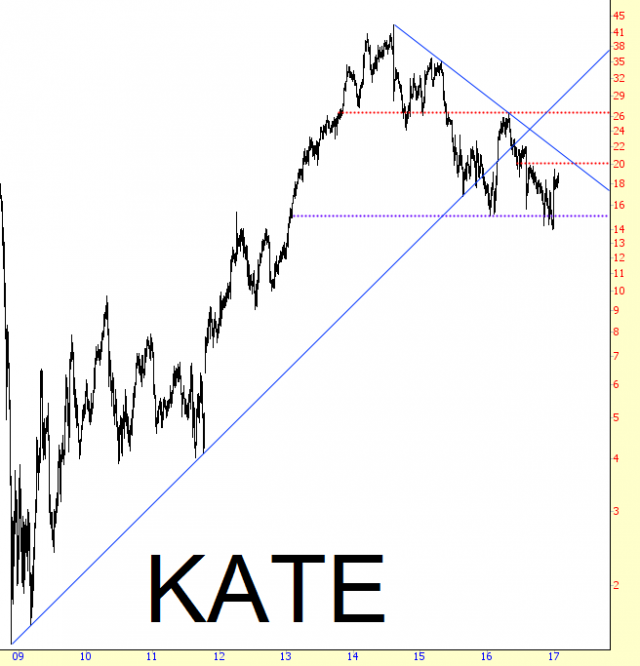
Another storefront at your local luxury mall is Kate Spade & Co (NYSE:KATE). It found strength off and on recently due to buyout chatter (they are desperately trying to sell themselves), but the pattern is bearish, and just so you are clear, just because a company is for sale doesn’t mean there will be any buyers. Just ask Twitter.
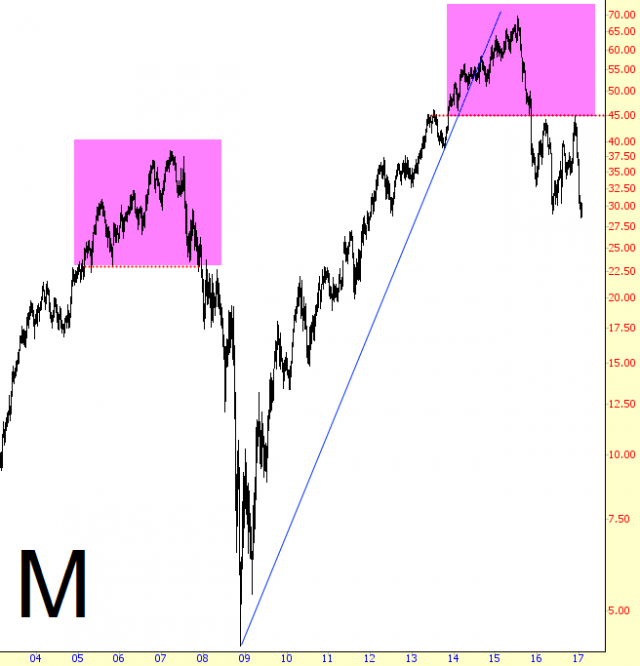
Speaking of analogs, take a look at Macy’s Inc (NYSE:M). Even though the stock has lost over half its value, if history is any guide, there are doomed as doomed can be (this is more impressive if you say it in an Ed Grimley voice).
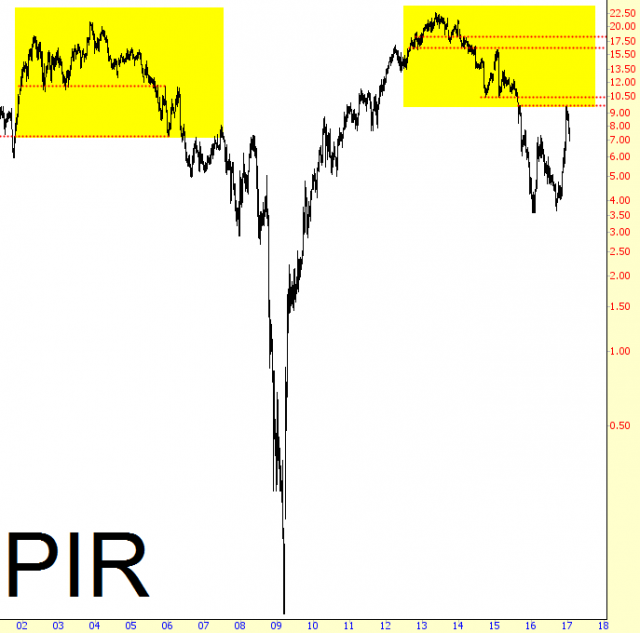
Hold on there……..it’s another analog……and from another company I pick on a lot: Pier 1 Imports Inc (NYSE:PIR), purveyor of scented candles, throw pillows, and monkeys carved from coconuts. This is another fine example of how just because a stock has already suffered a momentous collapse (about 65% so far) doesn’t mean it isn’t just going to keep collapsing. Firm support exists at $0.00.
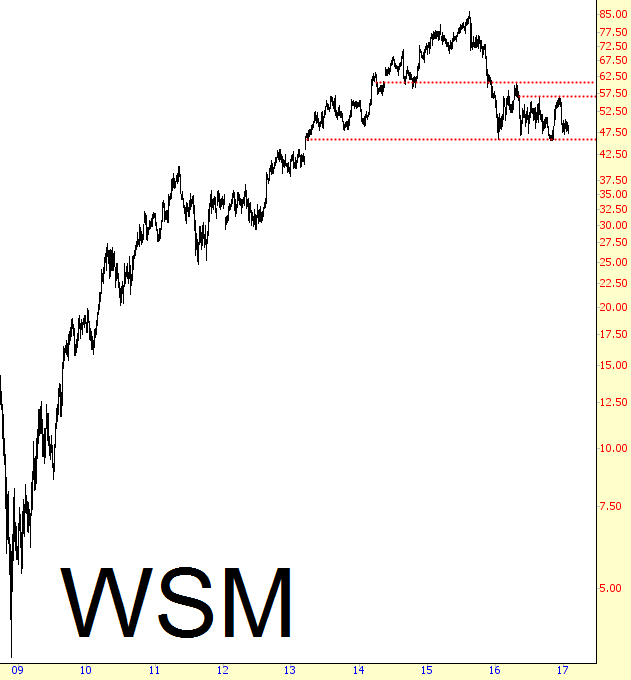
Overpriced seller of kitchenware, Williams-Sonoma Inc (NYSE:WSM), is setting itself up for a big fall. It has found support for years in the mid 40s, but don’t count on that surviving the year intact.
I will say, however, that some retailers are so far gone, the opportunity has already passed by. Stage Stores Inc (NYSE:SSI) is a good example of a ship that’s already sailed.
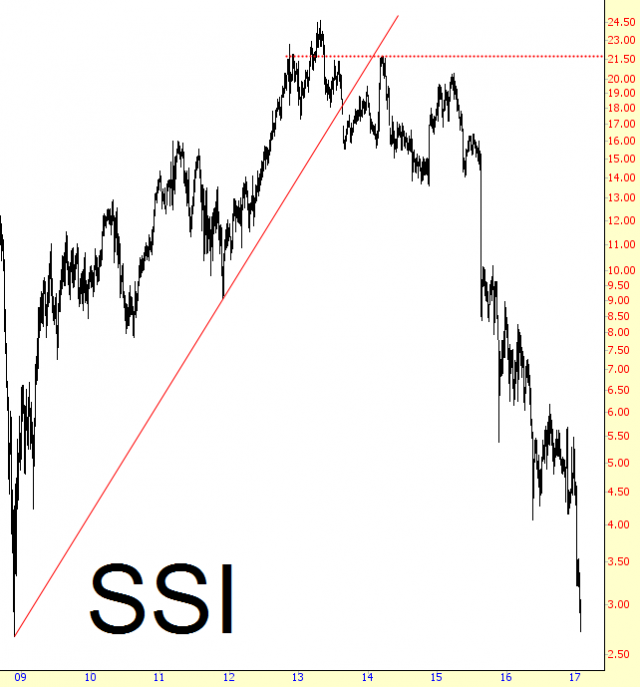
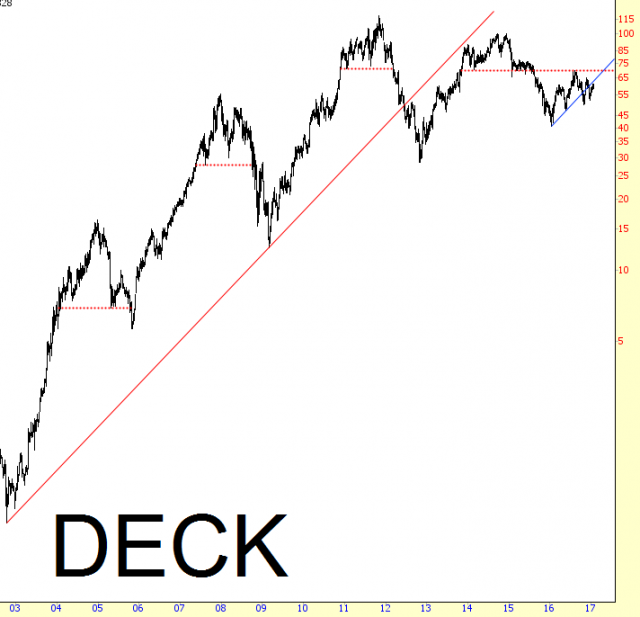
On the other hand, Deckers Outdoor Corporation (NYSE:DECK) (makers of the UGG shoe line, among others) has plenty of juice left to squeeze.
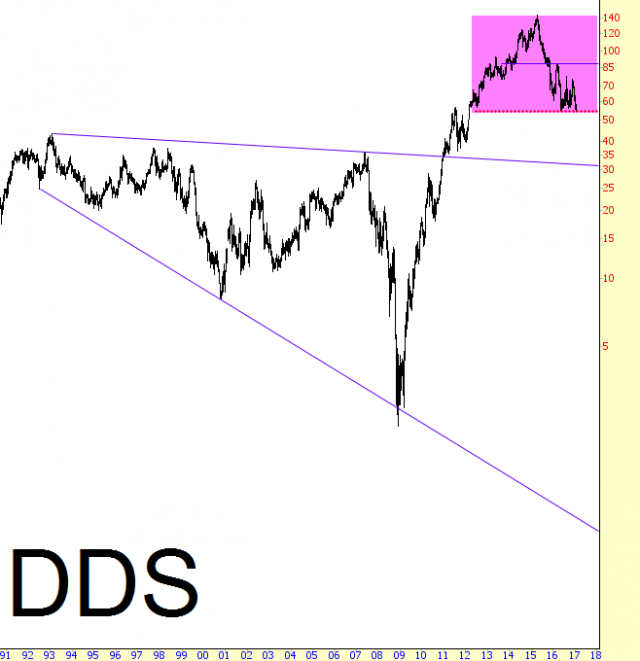
Dillards' (NYSE:DDS) is another stock which has lost about 60% of its value already but doesn’t look anywhere close to being done falling.
What got me thinking about all this was my best-performing short position, CBL & Associates Properties Inc (NYSE:CBL). I wasn’t sure what they did, but it turns out they are a big player in retail real estate – – hence their stock is also in a terrific analog and appears to be screwed and tattooed.
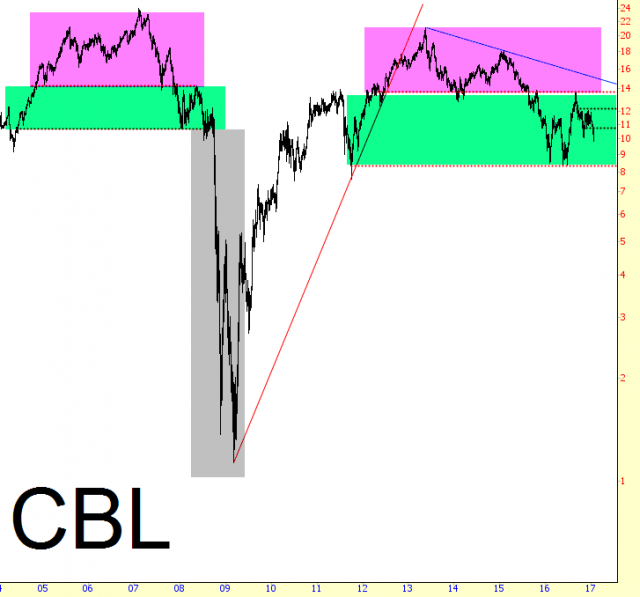
If anyone is looking for rumblings to signal the kind of break in 2006/2007 that preceded the financial crisis, look no further than the charts above.
