
Rent-A-Center, Inc. (NASDAQ:RCII) delivered third-quarter 2018 results, wherein both the top and bottom lines surpassed the Zacks Consensus Estimate. Analysts pointed that bottom line benefited from cost containment efforts.
Let’s Delve Deep
The company delivered adjusted earnings of 32 cents a share that beat the Zacks Consensus Estimate of 29 cents and also compared favorably with a loss of 15 cents reported in the year-ago period. Total revenue of $644.9 million also came ahead of the consensus mark of $635 million.
The top line grew marginally by 0.2% on account of solid comparable-store sales (comps) growth, partly offset by closures of certain Core U.S. locations. Meanwhile, adjusted EBITDA came in at $49.3 million, up significantly from $17.1 million in the year-ago quarter. Moreover, adjusted EBITDA margin expanded 500 basis points to 7.6%.
Quite apparent, the company’s strategic initiatives are well on track. Management intends to focus more on cost containment endeavors, improving traffic trends, targeted value proposition, refranchising program and augmenting cash flow. Further, the company is rationalizing store base and lowering debt load. Markedly, the company’s cost-saving initiatives are way ahead of track, making it hopeful of generating annual run-rate savings of more than $100 million.
Notably, shares of Rent-A-Center, which accepted the buyout offer of Vintage Capital, have surged roughly 43% in the past six months, against the industry’s decline of 17%.
Rent-A-Center, Inc. Price, Consensus and EPS Surprise
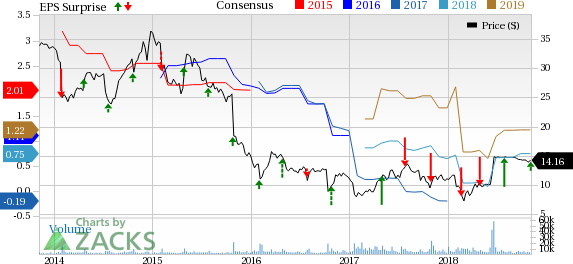
Rent-A-Center, Inc. Price, Consensus and EPS Surprise | Rent-A-Center, Inc. Quote
Comparable-Store Sales Performance
Comps for the quarter grew 5.7%, reflecting growth of 5.2%, 6.7% and 12.8% across the Core U.S., Acceptance Now and Mexico segments, respectively.
Notably, comps for the Core U.S. and Mexico segments have improved 170 and 570 basis points sequentially, respectively, while for the Acceptance Now the same has increased 300 basis points on a sequential basis.
Consolidated comps for this Zacks Rank #1 (Strong Buy) company also portray a sequential improvement of 200 basis points. You can see the complete list of today’s Zacks #1 Rank stocks here.
Segment Performance
Revenues from the Core U.S. segment rose 1.9% to $451.3 million due to improved comps performance partly offset by continued store base rationalization.
Revenues from the Acceptance Now segment fell 5.9% from the prior-year quarter to $173.4 million on account of closures of the company’s Conn’s and HHGregg locations. These were partly mitigated by healthy comps performance.
Mexico segment’s revenues came in at $12.8 million, up marginally from $12.2 million reported in the year-ago period but improved 11.3% on a constant currency basis.
Finally, total Franchising revenues surged 58.4% to $7.4 million during the reported quarter. This can be attributed to recent change in the accounting standard for franchise advertising fees and higher merchandise sales due to increased store count.
Store Update
At the end of the quarter, there were 2,205 Core U.S. locations, 1,107 Acceptance Now Staffed stores, 119 Acceptance Now Direct stores, 122 stores in Mexico and 245 Franchise stores.
Other Financial Aspects
Rent-A-Center, which shares space with McGrath Rentcorp (NASDAQ:MGRC) , AeroCentury Corp. (NYSE:ACY) and Aaron's, Inc. (NYSE:AAN) , ended the reported quarter with cash and cash equivalents of $111 million, net Senior notes of $539.7 million and stockholders' equity of $283.7 million. The company incurred capital expenditures of $6.8 million during the reported quarter.
Today's Stocks from Zacks' Hottest Strategies
It's hard to believe, even for us at Zacks. But while the market gained +21.9% in 2017, our top stock-picking screens have returned +115.0%, +109.3%, +104.9%, +98.6%, and +67.1%.
And this outperformance has not just been a recent phenomenon. Over the years it has been remarkably consistent. From 2000 - 2017, the composite yearly average gain for these strategies has beaten the market more than 19X over. Maybe even more remarkable is the fact that we're willing to share their latest stocks with you without cost or obligation.
See Them Free>>
McGrath RentCorp (MGRC): Free Stock Analysis Report
AeroCentury Corp. (ACY): Free Stock Analysis Report
Aaron's, Inc. (AAN): Free Stock Analysis Report
Rent-A-Center, Inc. (RCII): Free Stock Analysis Report
Original post
Zacks Investment Research