
Reliance Steel & Aluminum Co. (NYSE:RS) posted profits of $165.6 million or $2.44 per share in the fourth quarter of 2019, up around 94% from $85.6 million or $1.22 in the year-ago quarter. Earnings per share topped the Zacks Consensus Estimate of $1.71.
Reliance Steel recorded net sales of $2,447.8 million, down around 13% year over year, impacted by lower volumes and pricing. The figure missed the Zacks Consensus Estimate of $2,471.9 million.
The company witnessed continued strong demand for its products and services in aerospace and automotive markets during the fourth quarter. Demand in non-residential construction, the company’s biggest end-market, was also strong in the quarter.
While demand in heavy industry was steady, Reliance Steel saw low demand in the energy market in the fourth quarter. Demand in semiconductor improved during the reported quarter after weakness in the first three quarters of 2019.
Reliance Steel & Aluminum Co. Price, Consensus and EPS Surprise
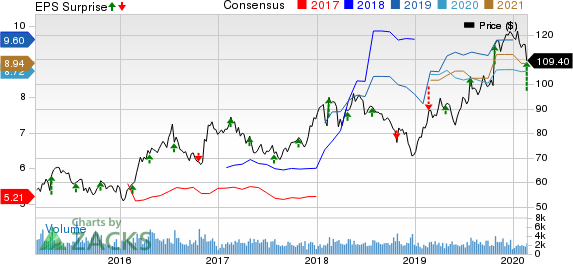
Reliance Steel & Aluminum Co. price-consensus-eps-surprise-chart | Reliance Steel & Aluminum Co. Quote
Volumes and Pricing
Overall sales volume went down around 4% year over year to roughly 1.38 million tons in the reported quarter. Volumes also declined around 7% on a sequential-comparison basis. Shipments fell sequentially due to normal seasonal slowdown resulting from customer holiday-related shutdowns and fewer shipping days.
Average prices per ton sold for the quarter fell roughly 10% year over year to $1,763. Prices also declined around 2% on a sequential-comparison basis.
Full-Year Results
Earnings for 2019 were $10.34 per share, down from $8.75 per share a year ago.
Revenues were $10,973.8 million for the full year, down around 5% year over year.
Financials
Reliance Steel ended 2019 with cash and cash equivalents of $174.3 million, up roughly 36% year over year. Long-term debt was $1,523.6 million, down around 29% year over year.
For 2019, cash flow from operations was $1,301.5 million, up roughly 96% from $664.6 million a year ago.
The company returned $201.3 million to its shareholders in 2019 in the form of dividends and share repurchases. Its board, on Feb 18, 2020, declared a quarterly cash dividend of 62.5 cents per share, an increase of 13.6%.
Outlook
The company is optimistic about business conditions in the first quarter of 2020. It expects demand to stay relatively healthy in the quarter.
Reliance Steel projects total tons sold to be sequentially up 6%-8% in the first quarter. Overall metals pricing is expected to remain near current levels, which is likely to result in its average selling price per ton sold rising 1%-2% sequentially.
On the basis of these expectations, the company currently projects adjusted earnings in the range of $2.00-$2.10 per share for the first quarter.
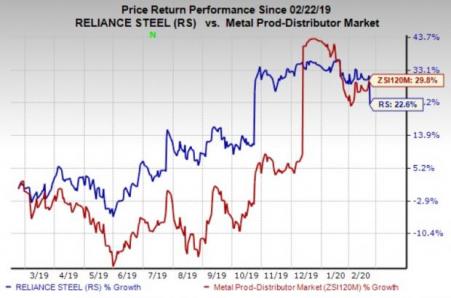
Price Performance
Reliance Steel’s shares are up 22.6% in the past year against the industry’s 29.8% rise.
Zacks Rank & Key Picks
Reliance Steel currently carries a Zacks Rank #3 (Hold).
Some better-ranked stocks in the basic materials space include Daqo New Energy Corp. (NYSE:DQ) , NovaGold Resources Inc. (NYSE:NG) and Commercial Metals Company (NYSE:CMC) .
Daqo New Energy has projected earnings growth rate of 353.7% for 2020 and sports a Zacks Rank #1 (Strong Buy). The company’s shares have rallied roughly 92% in a year’s time. You can see the complete list of today’s Zacks #1 Rank stocks here.
NovaGold has projected earnings growth rate of 11.1% for the current fiscal and carries a Zacks Rank #2 (Buy). The company’s shares have surged around 142% over a year.
Commercial Metals has estimated earnings growth rate of 20.7% for the current fiscal and carries a Zacks Rank #2. The company’s shares have shot up roughly 22% in a year’s time.
More Stock News: This Is Bigger than the iPhone!
It could become the mother of all technological revolutions. Apple (NASDAQ:AAPL) sold a mere 1 billion iPhones in 10 years but a new breakthrough is expected to generate more than 27 billion devices in just 3 years, creating a $1.7 trillion market.
Zacks has just released a Special Report that spotlights this fast-emerging phenomenon and 6 tickers for taking advantage of it. If you don't buy now, you may kick yourself in 2020.
Click here for the 6 trades >>
Reliance Steel & Aluminum Co. (RS): Free Stock Analysis Report
Commercial Metals Company (CMC): Free Stock Analysis Report
DAQO New Energy Corp. (DQ): Free Stock Analysis Report
Novagold Resources Inc. (NG): Free Stock Analysis Report
Original post
Zacks Investment Research