2020 is finally in the books, and many REITs (real estate investment trusts) remain in the bargain bin. Is it time to buy these generous dividend payers and bet on a 2021 rebound?
Savvy contrarians that we are, we’re focusing on REITs because they are the one part of the market that was left behind as everyone rushed back into stocks in the back half of 2020.
Normally, REITs more or less track the blue-chip index, but when COVID-19 crushed these landlords’ tenants, that changed in a big way: investors sold REITs—and they’re still on the mat.
REITs Fall Behind
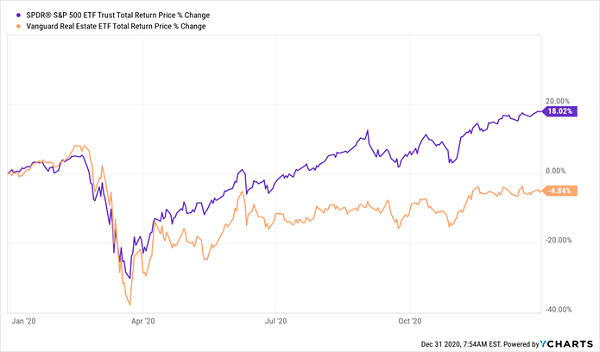
That orange line is the price return of the benchmark Vanguard Real Estate ETF (NYSE:VNQ), which yields 4% today—a massive payout in today’s zero-point-nothing interest-rate world.
And plenty of folks have started to notice that yield, which is why REITs showed some life in the last part of the year, with VNQ catching up to, and at times exceeding, the S&P 500:
REITs Sputter Back to Life
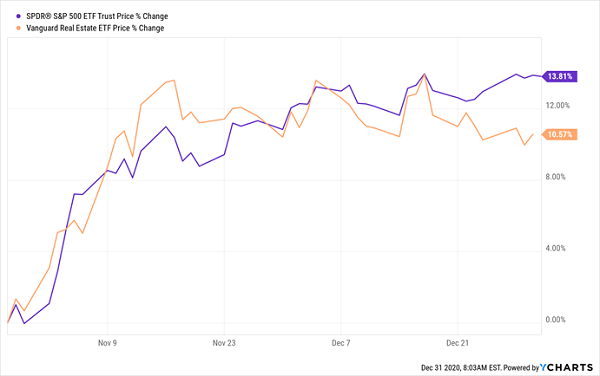
That’s a good sign, to be sure, but we can’t just buy VNQ and expect to ride it to further gains. Because as I wrote last week, the REIT market is badly split, with e-commerce-loving warehouse REITs and healthcare REITs looking a lot better than some other groups, like hotel REITs and, heaven forbid, retail REITs.
Retail REITs, in particular, are classic yield traps. Consider the biggest mall landlord of them all, Simon Property Group (NYSE:SPG), which boasts a forward yield of 6.1%, but that’s not because Simon’s payout is generous: delinquent (and bankrupt!) tenants forced management to cut its dividend 38% back in June.
In other words, that high yield is solely because Simon’s share price faceplanted:
Retail King’s Stock Collapses—and Bounces Along the Bottom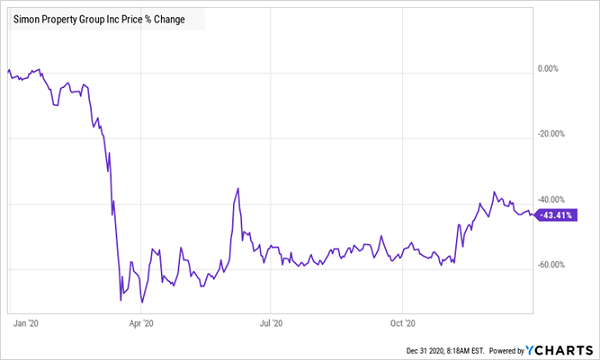
Simon could see a short-term bump, as it trades at an impossibly low 4-times its last 12 months of funds from operations (FFO, the best performance metric for REITs).
But it’s in trouble in the long run, as more of its tenants who are already deferring their rent are forced to close. According to REIT industry group NAREIT, mall owners were collecting just 81% of their rent in September (the last time NAREIT checked), with Simon showing a similar 85% rent-collection rate in Q3.
ETFs Force You to Buy Shaky REITs
This is the trouble with buying VNQ today: the ETF has to represent all REIT sectors, so it can’t dodge losers like Simon, the No. 9 holding in its portfolio.
The ETF has other big holdings I’m worried about, too, like warehouse REIT Prologis (NYSE:PLD). Since it’s sitting square in the path of soaring e-commerce, Prologis doesn’t have to worry about delinquent tenants—it collected 98.2% of its October rent, the last month for which figures are available.
Trouble is, everyone knows this, which is why Prologis trades at 32-times trailing-12-month FFO. That lofty valuation sets it up for a big drop on any bad news.
Other holdings are in businesses that COVID-19 has put on shaky ground, like VNQ’s 10th-biggest investment, Welltower (NYSE:WELL), a senior-care REIT that was a dividend go-to until it cut payouts in 2020. That shouldn’t have been a surprise: Welltower’s payout had been stagnating for years.
Welltower’s Diving Dividend Takes Out Its Stock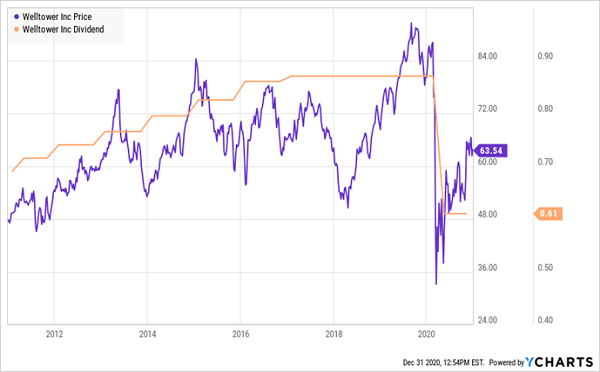
Finally, there’s No. 6 holding, Public Storage (NYSE:PSA), a leader in the self-storage space, which has a low barrier to entry that’s a big plus if you want to start your own storage setup—all you need to do is build the units, hand out keys and keep the dust off the shelves!
Trouble is, this has plagued the industry with too many units, which limits the rents self-storage REITs like PSA can charge. That’s one reason why the company hasn’t declared a dividend hike in more than four years:
PSA’s Dividend: As Tired as Its Business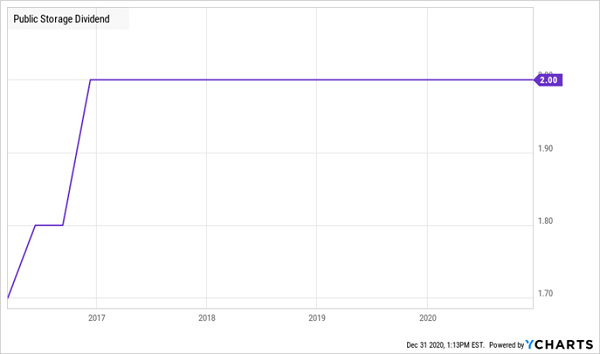
The company’s FFO has also been on a downward slide in the last 12 months, which could put the dividend in jeopardy: in the third quarter, PSA, paid out 88% of its FFO as dividends, way up from 72% a year ago.
CEFs: Better Than ETFs … But Still Not My Favorite
So if an ETF isn’t the way to go, how about a high-yielding closed-end fund (CEF)? If you’ve been reading my columns you know I’m a big fan of CEFs.
These actively managed funds boast big dividends—roughly 7% yields, on average—and many trade at discounts to net asset value (NAV, or the value of the investments in their portfolios) now.
So it might surprise you to hear that CEFs aren’t my preferred way to invest in REITs. To see why, consider the Cohen & Steers Quality Income Realty Fund (NYSE:RQI). Its manager, Cohen & Steers, is a well-respected investment shop that’s been around, and focusing on REITs, since 1986.
And RQI has easily outperformed VNQ over the last decade, with a lot of its return coming in cash, thanks to its outsized dividend (current yield: 7.9%).
RQI Outperforms—but It Can Be Volatile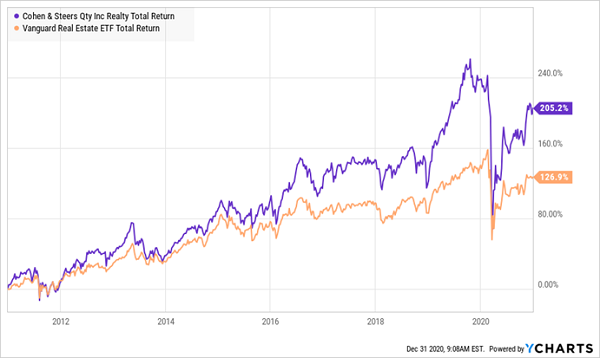
Even so, this one’s not for the faint of heart—as you can see above, its performance has been a lot more volatile than that of VNQ.
And the fund still has exposure to all the worrisome REITs VNQ holds: Prologis, Public Storage, Welltower and Simon Property Group are all top holdings.
Individual REITs Are the Way to Go
All of this is to say that, when it comes to REITs, picking individual stocks is really the only way to avoid shaky businesses and zero in on overlooked bargains.
I gave you some names in the industrial and specialized-office spaces to put on your list in my December 30 article, including warehouse operator W.P. Carey (NYSE:WPC), which is in the same business as Prologis but trades at a much more reasonable 12-times FFO and boasts a 6% dividend, compared to PLD’s 2.4%.
I’d also add data-center REIT Equinix (NASDAQ:EQIX) and cell-tower operator Crown Castle (NYSE:CCI) to the mix. Both have put on strong runs this year, but both have pulled back of late, serving up some nice entry points for us:
CCI and Equinix Give Us a Nice Buy Window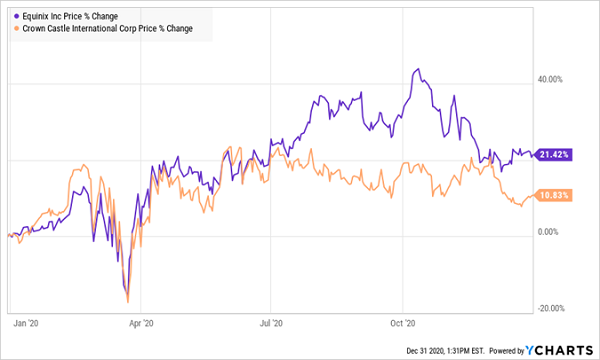
Neither company is known for high current yields, as we can see below, but their strong dividend growth means the yield on your original buy will rise in short order.

While Equinix’s valuation looks high, at 28-times trailing-12-month FFO, it’s down sharply from the 34-times FFO at which the stock traded in early October. CCI, too, has seen its valuation fall to more reasonable levels in recent weeks.
And these dividends are safe, especially in light of these REITs’ rising FFO. Equinix, in fact, could double its dividend today and its payout ratio would still be just fine.
Disclosure: Brett Owens and Michael Foster are contrarian income investors who look for undervalued stocks/funds across the U.S. markets. Click here to learn how to profit from their strategies in the latest report, "7 Great Dividend Growth Stocks for a Secure Retirement."
