Evidence is mounting that the disinflationary dive following the onset of the coronavirus crisis in the spring of 2020 is fading, giving way to a run of reflation. There’s a popular narrative that equates reflation with inflation, and that the former is destined to lead to the latter. Maybe, but maybe not.
This much is clear: markets are pricing in higher odds that a meaningful reflationary run has started. It’s open for debate if this is sustainable, but for the moment the reversal is conspicuous. The critical issue is whether trends that prevailed before the pandemic are broken to the upside in the weeks and months ahead. That’s a work in progress and for now remains an open debate.
Meantime, quick digression: reflation and inflation are distinctive economic phenomena. Using the Wikipedia definition:
“Reflation, which can be considered a form of inflation (increase in the price level), is contrasted with inflation (narrowly speaking) in that ‘bad’ inflation is inflation above the long-term trend line, while reflation is a recovery of the price level when it has fallen below the trend line.”
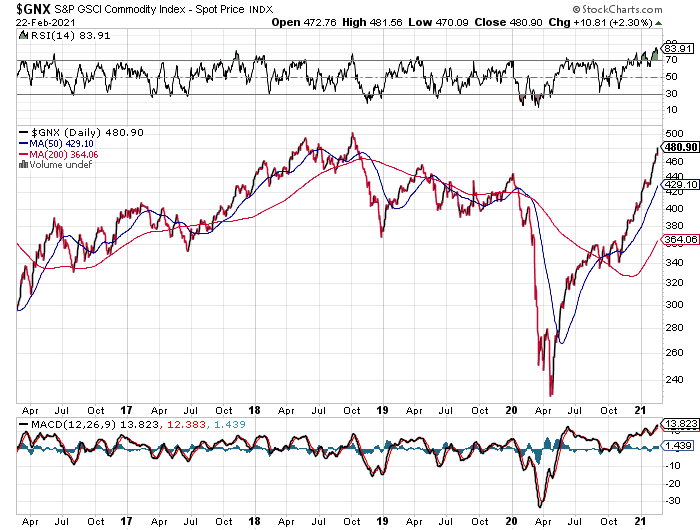
Perhaps Exhibit A for reflation at the moment is the sharp rebound in commodity prices. After crashing in the first half of 2020, the S&P GSCI Commodity Index has rebounded sharply, more than doubling from last year’s trough.
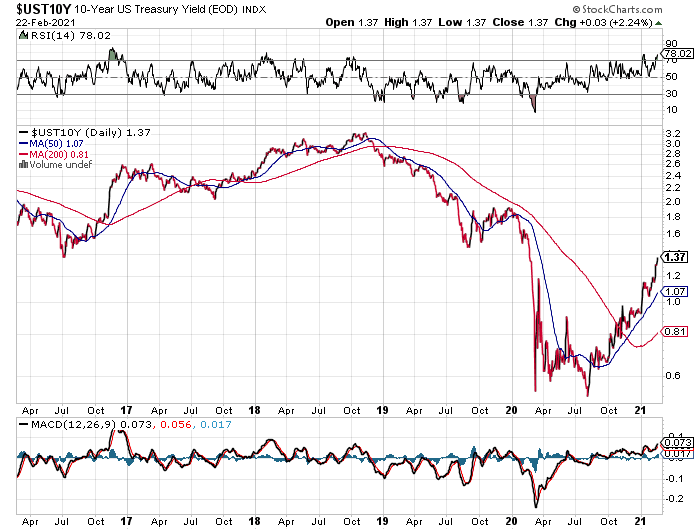
Interest rates have also recovered from last year’s dramatic slide. The benchmark 10-year Treasury yield rose to 1.37% yesterday (Feb. 22), a near-tripling relative to last year’s low.
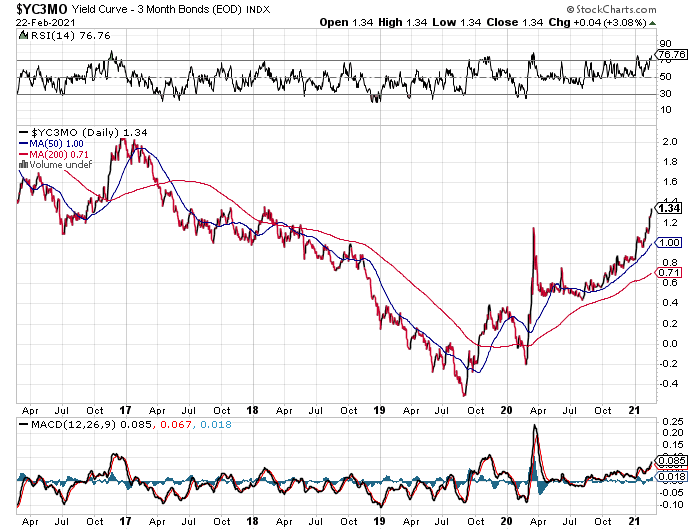
The Treasury yield curve has steepened, too, which is effectively pricing in firmer economic growth and a solid dose of reflation. At yesterday’s close, the 10-year/3-month yield spread closed at 134 basis point, the highest in nearly four years.
The question is whether the reflationary bias of late is more than a return to conditions in the pre-pandemic world? The case for arguing “yes” draws heavily on two forces that will converge to drive prices higher the months and years ahead:
- The unleashing of pent-up demand that was sidelined during the pandemic
- Unusually aggressive fiscal and monetary stimulus intent on repairing, reviving and financing stronger economic activity
The pushback is that the secular forces that created the disinflationary winds in recent decades are still swirling: an aging population that favors savings over consumption, the endless march of technology that creates new efficiencies that puts downward pressure on pricing, and other factors. These forces, say the disinflationistas, will keep reflation from turning into inflation.
Deciding which outlook will prevail is subject to a hefty dose of uncertainty at this stage, but 2021 will likely be a pivotal year for deciding which way the wind is blowing.
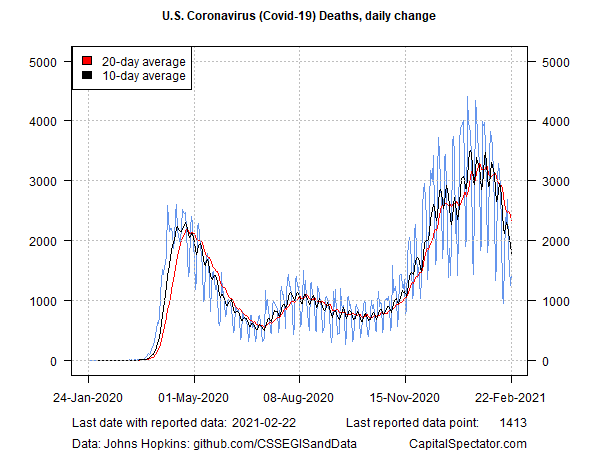
All the more so if the coronavirus crisis continues to fade. A critical benchmark suggests that’s a reasonable forecast for the months ahead. The daily change in new US COVID-19 fatalities has, for now, peaked. The 10-day average fell below the 2,000 mark for two straight days through yesterday (Feb. 23) – the lowest since late-November. As the rollout of vaccines continues and warmer weather approaches, the case for cautious optimism is strengthening.
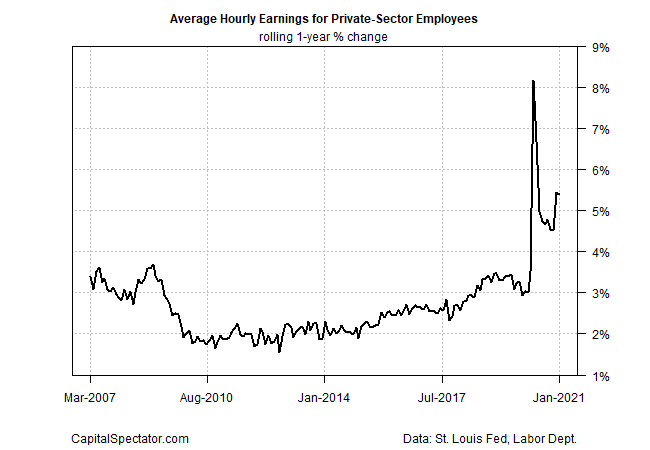
Meanwhile, the big question is whether the core rate of inflation will respond to the reflationary burst of late? There are hints that firmer pricing pressure is brewing on this front. For instance, consider the strong upward bias in wage pressure recently. The annual pace of the average hourly earnings for private-sector employees is running sharply higher these days.
If inflation worthy of the name is on track to rise substantially, the statistical canary in the coal mine (or at least one of them) is core CPI. For the moment, that bird still looks tame. Core CPI’s annual rate ticked down to a mild 1.4% in January—well below the Fed’s 2% target.
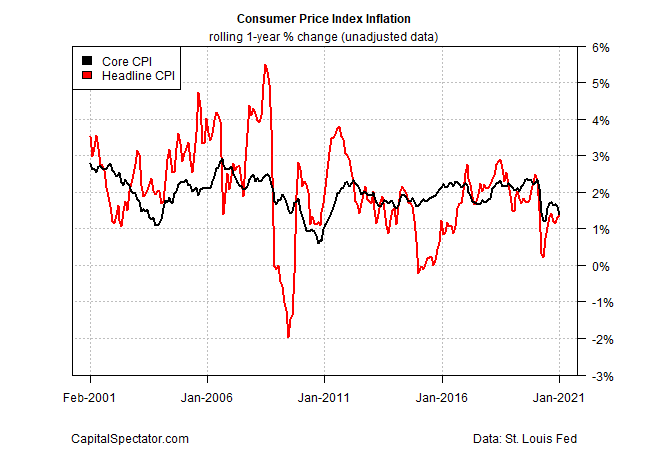
When and if this rate shows signs of moving decisively higher, persistently above 2%, the canary will be singing loud and clear.
“We’re at a place where the markets are starting to grapple with the question of whether there are trade-offs between more stimulus today and potentially higher rates and more inflation down the road,” says Nathan Sheets, chief economist of PGIM Fixed Income and a former Treasury and Fed official.
