
Our continued research into the state and status of the real estate market continues to point to a process that is starting to unfold in the U.S. that may put price and activity levels at risk. Within the past two segments of this research article, we've highlighted how market cycles and recent market data point to a real estate market that may be in the early stages of a downward price cycle.
Additionally, within Part II of this article, we highlighted the human psychological process of dealing with a crisis event which also suggests a deepening price contraction event may take place within the next 12 to 24+ months.
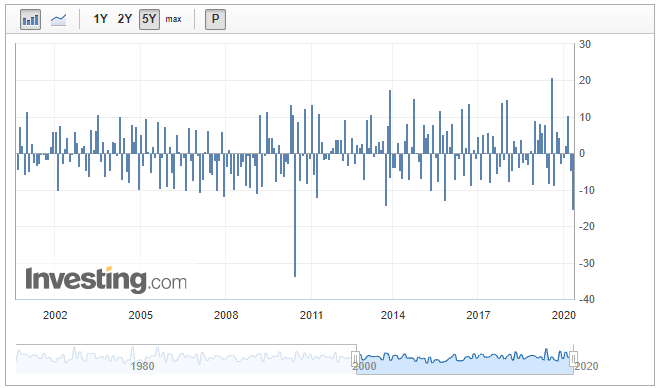
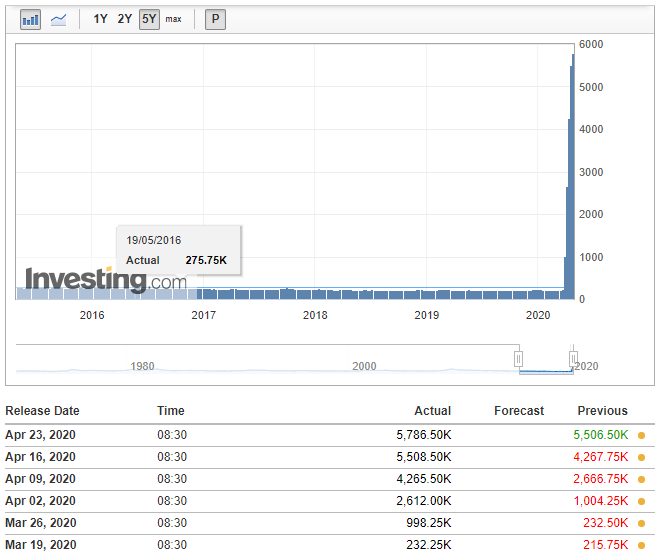
U.S. New Home Sales Data Just Released
We believe the psychological process is just starting to become evident in the current data. For example, the U.S. New Home Sales data was just released and it shows the sharpest decline in activity since June 2010 (nearly 14 months after the actual bottom in the U.S. stock market in March 2009).
Our researcher team believes investors/traders and many consumers have become complacent with the current data and are simply in denial in attempting to relate future economic outcomes to the current set of circumstances. There has never been anything like this to disrupt global economic activity and consumer engagement over the past 100+ years. Not even the Great Depression or WWII was on this scale.
When you stop to consider the scale and scope of this COVID-19 virus event and the process of recovery, one should really ask serious questions about how quickly you believe the global economy will be able to recover to 2018-2019 economic activity levels, how quickly the world can create and sustain 25~75 million new jobs, and how quickly global nations can attempt to regain GDP output levels nearly equal to 2018-2019 levels?
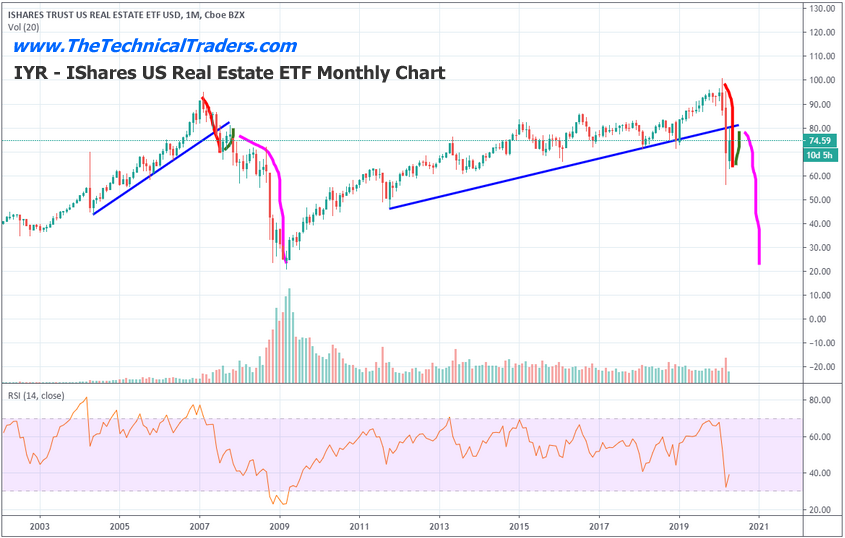
IYR Monthly Chart
Take a look at this IYR Monthly chart, below. The initial collapse in the markets in 2007 was the start of a similar type of economic and psychological crisis event. Notice how IYR started to move lower in early 2007 – well before the real collapse in the U.S. economy began in December 2008. Another aspect to consider is how long it took for IYR to recover back to near 2007 levels. From the bottom in early 2009, it took nearly six years for IYR to reach levels above $80 again.
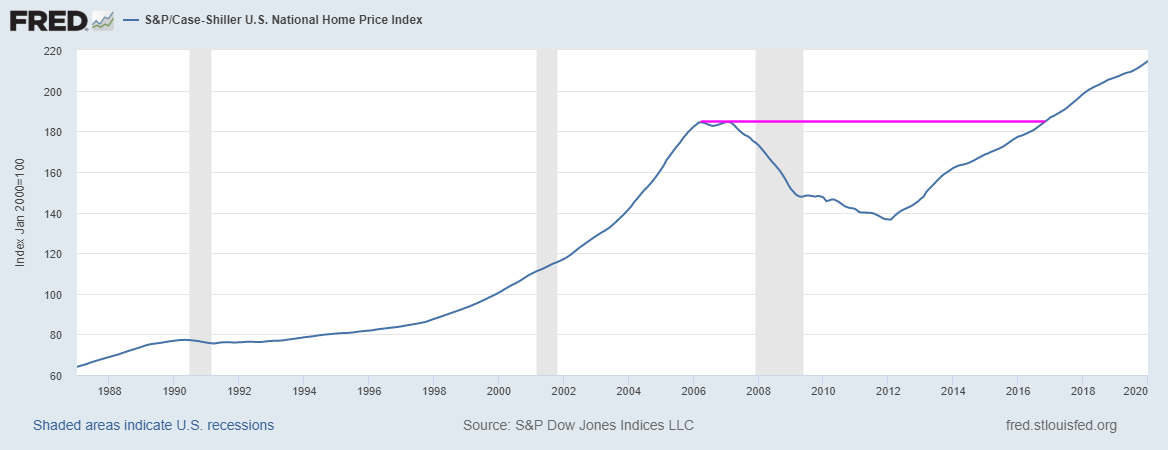
Case-Shiller U.S. Home Price Index chart
This Case-Shiller U.S. Home Price Index chart shows a similar setup taking place. The peak in home price values on this chart happened in early 2006 – well before the peak on the IYR chart in early 2007. The interesting component of this Case-Shiller chart is that real home price values didn't bottom until early 2012, whereas the speculative traders pushed the bottom in IYR in mid-2009. We believe the speculative side of investment and asset growth paired up near or after the 2011-12 time-frame where improved levels of economic growth and activity prompted real increased asset valuations in real estate.
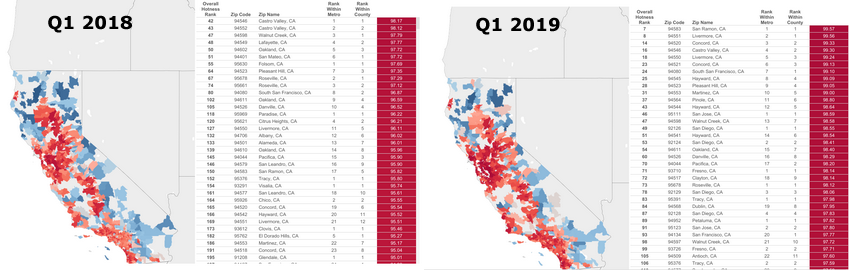
Currently, using the Realtor.com Hotness Index (https://www.realtor.com/research/reports/hottest-markets/), we can see that data reported in December 2019 shows a moderate shift away from certain “hot” areas in larger market areas. Pay attention to how the RED colors in 2018 have changed (in some areas) compared with Q1 2019 levels on these charts below. We believe the continued shift towards a real estate recession is currently taking place and that these Hotness areas will suddenly cool very quickly as new data is published.
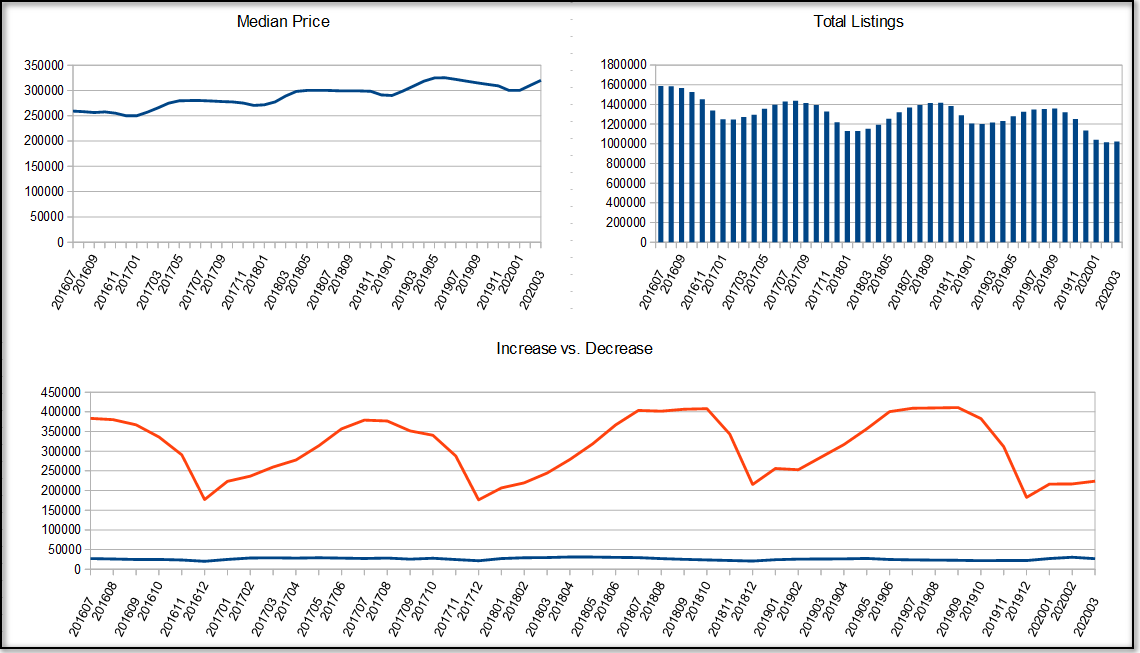
Fresh Data Released From Realtor.com
Fresh data released today from Realtor.com data (updated on 4/2/2020: https://www.realtor.com) suggests a peak in the housing market may be setting up. Total active listings have declined steadily over the past 4+ years while median price levels have continued to climb. This is a sign that the real estate market has been within a moderately tight “seller's market,” where buyers are competing for the best properties. The Increase (Blue) to Decrease (Orange) data suggests that price levels tend to stabilize in Q4 of each year, where sellers are unwilling to move away from their expected listing price. Q1 through Q2 see dramatic increases in both levels of price alterations as the activity level tends to flatten out in the early portion of each year.
Concluding Thoughts:
Our conclusion from this data is that sellers may become increasingly desperate to reprice assets if a shift in the real estate market dynamics takes place as a result of the COVID-19 virus event. As of July 2019, price level decreases reached the highest levels over the past 4+ years, reaching 30% of all total listings. Currently, this ratio for March 2020 is at 21.8% and is certain to climb higher.
As the human process of dealing with this virus crisis event continues to take place, we are certain that asset values and expectations will shift as they have in the past. Jobless numbers hit again today withanother massive 4.42 million new jobless claims over the past week. Take a look at the charts below to see just how dramatic this event is turning out to be for American workers.
Anyone expecting the real estate market to survive this massive virus event unscathed is simply not seeing the data as clearly as one should. We believe once the data starts to breakdown to really show the contraction in activity, price and expectations, then a new real estate recessionary trend will take place, where real values will attempt to establish a true bottom. Our belief is this process may take as long as 18+ months to really bottom out and the true bottom really depends on when consumers transition away from the fear and helplessness phases and start to become optimistic again.
I am hoping people can see what I am trying to warn about, which is the next major market crash, much worse than what we saw in March.