- Time to sell SGB10Y ASW - Take profit in long-end relative flattener
- Add to the Dec20 leg in Dec20/Dec21 SEK FRA steepener
- SEK rebound with Riksbank hike and global risk appetite
Trades
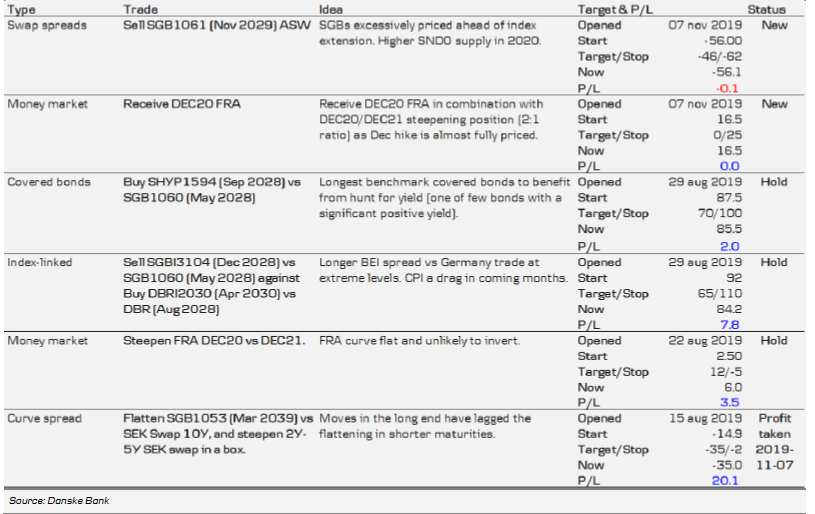
New, Sell SGB1061 (Nov 2029) ASW @-56bp P/L: -46bp/-62bp
New, Receive Dec20 SEK FRA @16.5bp P/L: 0bp/25bp
Profit taken, Flatten SGB1053 (Mar 2039) versus 10Y swap in a box versus 2Y-5Y @- 35bp (20bp profit)
Danske Bank’s market view in a nutshell
Inflation to remain below Riksbank’s forecast
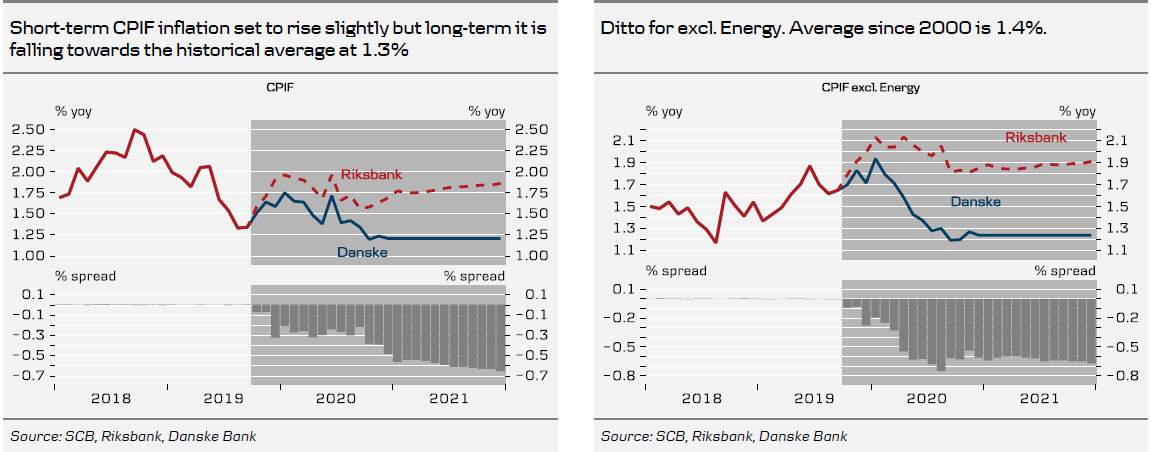
We expect inflation measured as CPIF and CPIF excl. Energy to print 1.5% y/y and 1.7% y/y, respectively, both 0.1 percentage points below the Riksbank’s forecasts. According to our forecast (now extended to include 2021) neither of these measures will reach 2%. The fact that these forecasts become ‘flat’ in 2021 is just because we have repeated price forecasts for 2020 into 2021. This will eventually be changed as we get new information about, for instance, changes to taxes and charges.
The background is that - just as before - we expect wage cost pressures to be too low to generate a sustainable inflation path at 2%. Recent demands from some labour unions are slightly higher than in the previous wage rounds. We find it, however, very unlikely that the upcoming wage round will result in higher deals this time as the labour market is deteriorating.

Even with some help from a weaker SEK, it will be tough for import prices to compensate for this. We assume (as usual) that energy prices (both electricity and car fuel) will be stable, albeit with clear seasonal variation. We have not, however, put in the potential impact from reduced electricity grid fees, which is calculated to be about 0.1 percentage points per year in 2020-2023.
All in all, our long-term forecasts remain close to the historical average since 2000 (CPIF 1.3%, CPIF excl. Energy 1.4%). Note that since 2010 the averages are even lower (CPIF 1.1% y/y, CPIF excl. Energy 1.3% y/y). That should clearly be closer to the expected values than Riksbank’s forecasts.
Returning to the October forecast, this is a month with normally quite small price changes. This time, small price cuts primarily in recreation should be balanced by slightly higher food and electricity prices.
Data will be important after all
As we mentioned in a comment to the Riksbank minutes on Tuesday, there are some noticeable differences between the message in the press release after the policy announcement (24 October) and the discussion in the minutes. The press release and indeed Governor Ingves’ press conference gave us the impression that there will be a rate hike to zero in December, no matter what.
A rate hike still appears to be the base case (maybe 75% probability) but it does not seem as clear cut as we thought. Jansson undoubtedly remains sceptical and Flodén and Skingsley could possibly flip. Data up to the December meeting will matter. A source of uncertainty is that one seat on the board is vacant. A new deputy governor will be announced shortly (probably 8 November). We do not know who it will be, as the process of appointing board members is a black box.
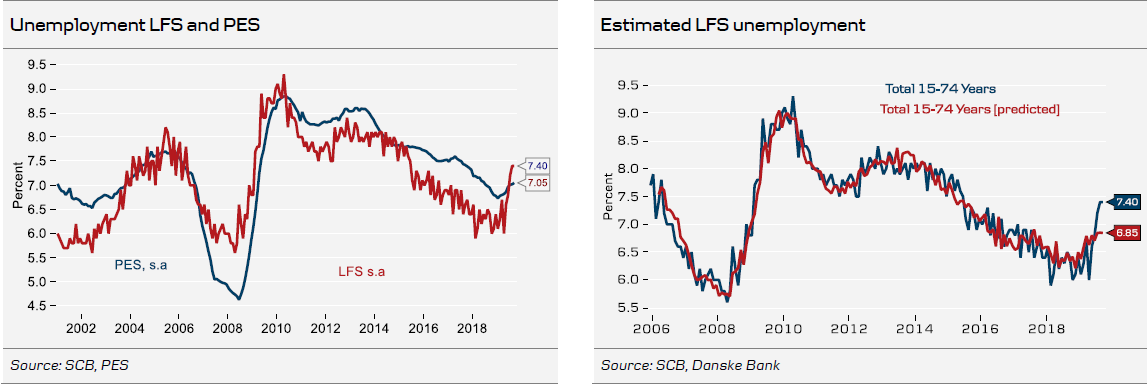
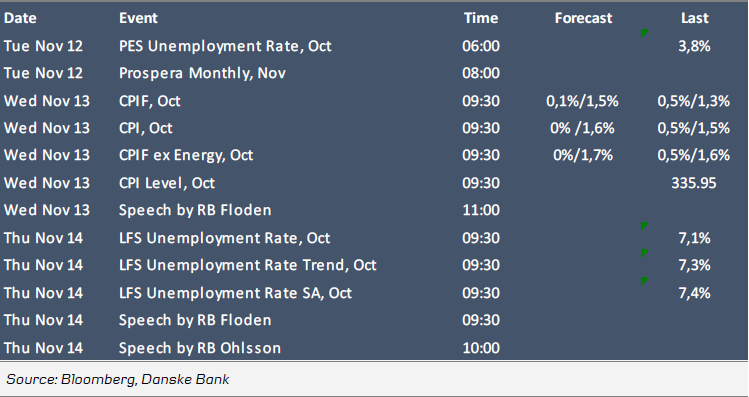
Next week, two sets of data are due for release, which under normal circumstances would have been very important; inflation and SCB’s labour force survey (LFS). Last month, however, SCB told the market that the survey suffers from certain data collection problems. Unemployment was probably underestimated in 2018 and early 2019 but the steep increase in more recent months is probably overestimated. SCB plans to release October LFS data on 14 November but it cannot say whether the release will include revisions of old data. For this reason we see no point in trying to make a precise forecast of the October unemployment number.
Until SCB manages to present more accurate figures, one has to rely on other indicators. One option is to compare LFS unemployment data with the ones from PES (public employment service). However, it is necessary to keep in mind that the two agencies’ definition of unemployment is different.
As illustrated in the chart below, PES unemployment never reached as low as LFS in the recent downturn. Secondly, PES confirms that unemployment started to pick up about a year ago but not as steeply as LFS numbers of late. The latest PES unemployment number is 7.1% (rounded). We have also made an estimation of LFS unemployment with variables such as hours worked, various survey-based indicators and PES unemployment as explanatory variables. Obviously the residuals have spiked lately. The predicted UNRseries (like PES) started to pick up around the turn of the year. The latest predicted value is 6.9% (rounded). So, until SCB delivers fresh data we assume that a true (seasonally adjusted) unemployment rate is in the proximity of 7% rather than 7.4% according to the latest SCB-release. If correct it would still be an ‘issue’ for the Riksbank considering that its latest projection shows unemployment reaching 7% only by Q1 21.
SCB also has certain problems with employment data so what is happening there? Survey data provide some clues. PMI figures for October have just been released. The employment indices for both manufacturing and services dropped and are now on the low side of 50.
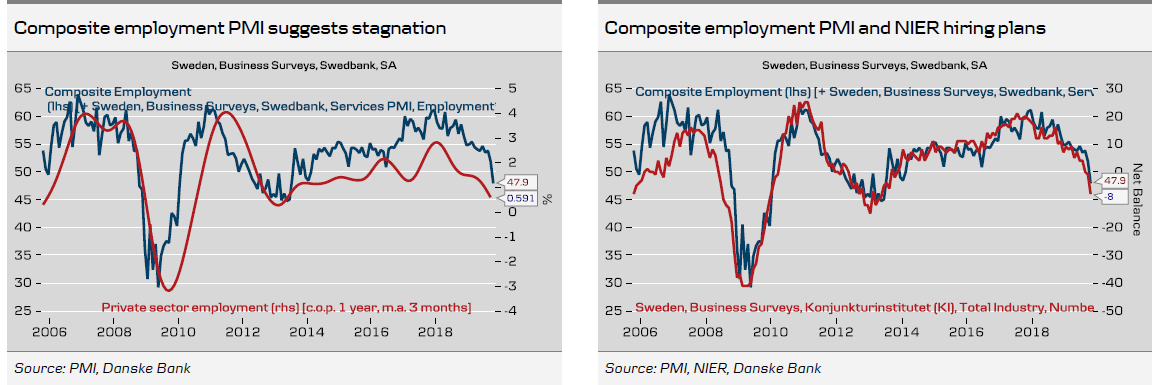
The composite PMI is not split up in sub-indices so we have calculated a proxy composite employment index by estimating the β-coefficients for manufacturing (0.28) and services (0.72) in the composite PMI headline index and then applying those coefficients to the employment sub-indices to calculate a composite employment index (see chart). The October reading was 47.9, down from 51.9, suggesting that private sector employment is stagnating and possibly heading towards contraction. It can also be noted that the calculated composite employment PMI aligns quite well with the NIER private sector hiring plans indicator.
Quick comment on Debt Office figures
The Debt Office showed a budget surplus for October of SEK31.9bn versus a projected SEK30.2bn surplus. However, the interesting thing is that the Debt Office once again said that tax revenues came in lower than expected and this time around it explicitly pointed to larger withdrawals (corporates are able to deposit money at the Debt Office at zero, thereby avoiding negative deposit rates at banks). This is worth keeping an eye on. In the latest forecast, the Debt Office did not lower the budget projection for 2020 despite scaling down macro forecasts. The reason was that it lowered the assumption regarding withdrawals from the tax account by SEK20bn compared with the previous forecast. In other words, without this change, the budget balance would be SEK20bn lower in 2020. Our guess is that the Debt Office (like most other forecasters then) did not foresee any rate hikes from the Riksbank. Now, if the Riksbank does what it says and hikes to zero in December and that hike feeds through to banks’ deposit rates (which seems a reasonable assumption), the incentive to keep cash at the Debt Office fades. If so, the borrowing requirement will rise and eventually the Debt Office may have to increase the issuance volumes of bonds more than currently planned.
Next week’s events
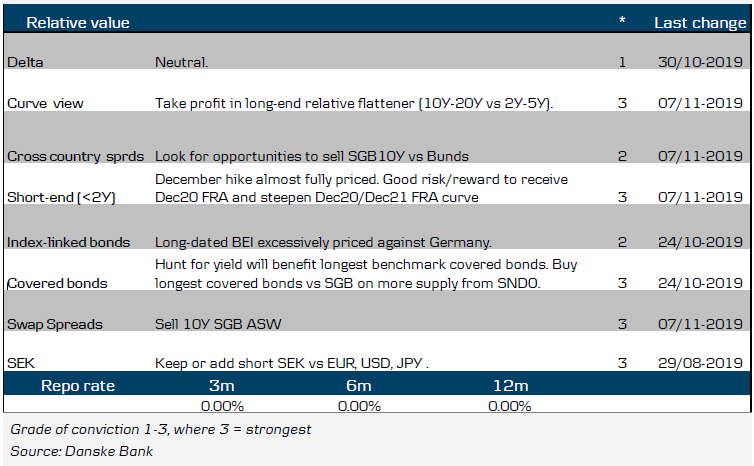
Time to sell SGB10Y ASW – Take profit in long-end relative flattener
In last week’s RTM Sweden, we argued in favour of selling 10Y SGBs either versus swaps or against Bunds, as the market will have to absorb more risk in 2020 compared to previous years. However, we did not initiate a recommendation as we reasoned that the upcoming extensions would perhaps provide even more attractive entry levels.
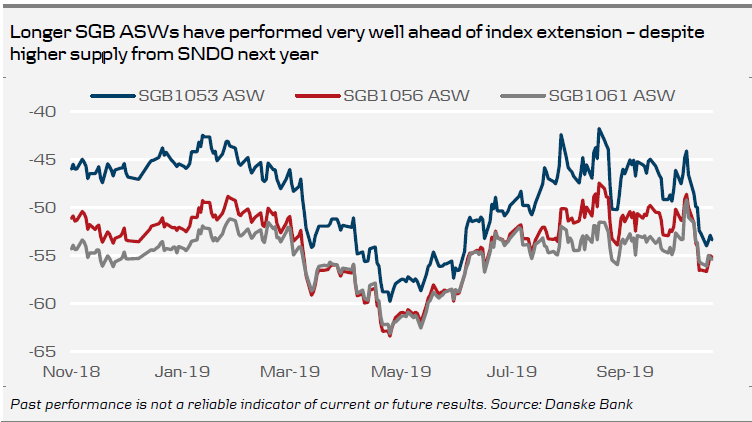
Likely on the back of the upcoming index extensions (as SGB1047 and SGBi3102 get shorter than 1Y and are thus removed from bond indices), longer SGBs have performed remarkably well, even though we have yet to reach the actual index extensions. SGB 1053 (Mar 2039) in particular has performed rapidly in recent weeks. The longest ASW spreads in SGBs are nearing historical lows, despite the recent announcement by the SNDO that issuance volumes are gradually being ramped up.

Looking at historical index extensions, there is a tendency for longer SGBs to perform ahead of the index extension and underperform thereafter. Below we have looked at the average changes on ASW and against Bunds around the previous index extensions larger than 0.4Y for government bonds since 2010. There seems to be a clear pattern to ‘buy the rumour, sell the fact’. Hence, we recommend selling SGB1061 ASW at -56bp, with P/L levels set to -46bp/-62bp.
Moreover, in one of our previous recommendations we have been long SGB1053 (March 2039) in a rather unusual combination. We had a relative flattener 10Y/20Y versus a 2Y/5Y steepener, as the latter segment was trading stretched relative to the 10Y-20Y segment. As SGB1053 traded cheap relative to swaps at the time, we substituted the swap leg for SGB1053s. Given the recent flattening of the long end in Sweden, likely a result of the upcoming index extension, we have reached our target level of -35bp and we hence close the recommendation with a 20bp profit.
Add to the Dec20 leg in Dec20/Dec21 SEK FRA steepener
As we argued in our Riksbank comment following the minutes, we see good risk/reward in receiving the Dec20 SEK FRA, as the risk to the policy rate, once back to zero, seems more symmetric than we previously thought after the MPR. In the minutes, Ingves, Flodén and Skingsley all opened up for future rate cuts if needed and we also noted that no board members foresee a scenario with a protracted hiking cycle. Given that we foresee a sharper downturn during 2020 compared to the Riksbank forecasts, we find it reasonable for the market to start to price in a probability of a rate cut at some point. Hence, we choose to add more of the Dec20 FRA to the Dec20/Dec21 position (for a 2:1 ratio), with the steepening position still giving some cushion for a general move higher in rates. We enter the additional Dec20 FRA position at 16.5bp with relatively wide target levels at 0bp/25bp.
SEK rebound with Riksbank hike and global risk appetite
The Riksbank rate decision two weeks ago was more hawkish than expected. It led to a significant repricing of December (from +8bp to +22bp) and induced some head-scratching in the FX market. There and then the interpretation was that the Riksbank wants to leave negative rates, regardless of what is actually happening in the economy. If rates were to be hiked to zero never again to be lowered into negative territory, this could be considered a pivotal factor for the carry-hampered SEK. That is one possible interpretation, but is it the right one? The SEK has nevertheless strengthened these past couple of days.
The Minutes, however, sounded differently. Certainly some board members are into the thought of hiking rates to zero in December, but such a decision is seemingly more conditioned on data than what was conveyed by the original communication. We are leaning towards that the hike will indeed happen. However, perhaps more importantly, evidently zero is no lower bound. Should the outlook worsen, rates could be cut back to - 0.25% once again. On top of that, the Riksbank could take ‘other actions’ (more QE?). Monetary policy could go either way after the December meeting. One could even argue that any potential asymmetry is tilted downwards rather than upwards, since no board member sees the need for more rate hikes in the near term (post December). Instead, some board members expressed concerns about sliding inflation expectations and should they continue to slide or if the outcome of the upcoming wage round disappoints the door is still open for a cut.
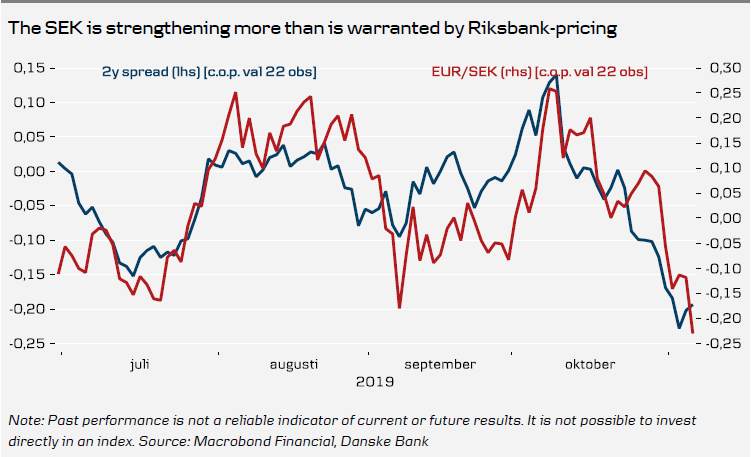
The market reaction to the soft Minutes was initially quite muted, both in EUR/SEK as well as in short rates were the RIBA-curve currently prices +20bp in December and +1bp H2 2020. Since then, however, the SEK has strengthened. It is possible that the market is positioning itself for a hike, but given pricing the potential in the SEK should be rather limited. If, at some time, cuts are back on the table it should push EUR/SEK higher.
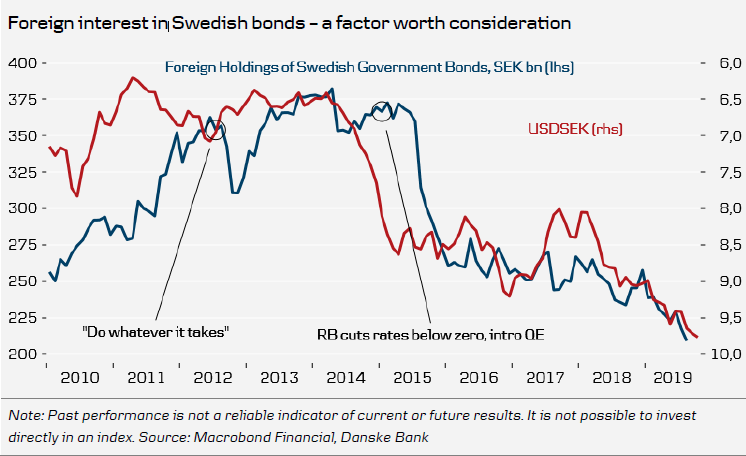
It is also plausible that expectations of an end to negative rates in Sweden could trigger some SEK-buying from foreign investors who for long have regarded the SEK as an undervalued prospective buy, without daring to take the leap. Historically, we have seen a rather strong covariation between foreign holdings of Swedish bonds and the SEK (see figure below). Following the Riksbank’s decision to enter negative territory and launch the QE programme, foreign investors gradually disappeared from the Swedish market. Higher Swedish bond rates coupled with the prospect of an increased supply of bonds are factors that could stabilise, or even turn around, this trend. An USD-based investor still has substantial carry working against him, but this is no longer the case for the EUR-based investor. From a technical standpoint, EUR/SEK 10.60 is an important level as is 200dma at 10.6278. If the cross breaks below those levels, the multi-year trend of higher and higher lows is broken and the market may then aim for 10.50. Model funds trading on momentum could receive further signals to sell, regardless of how macro develops.
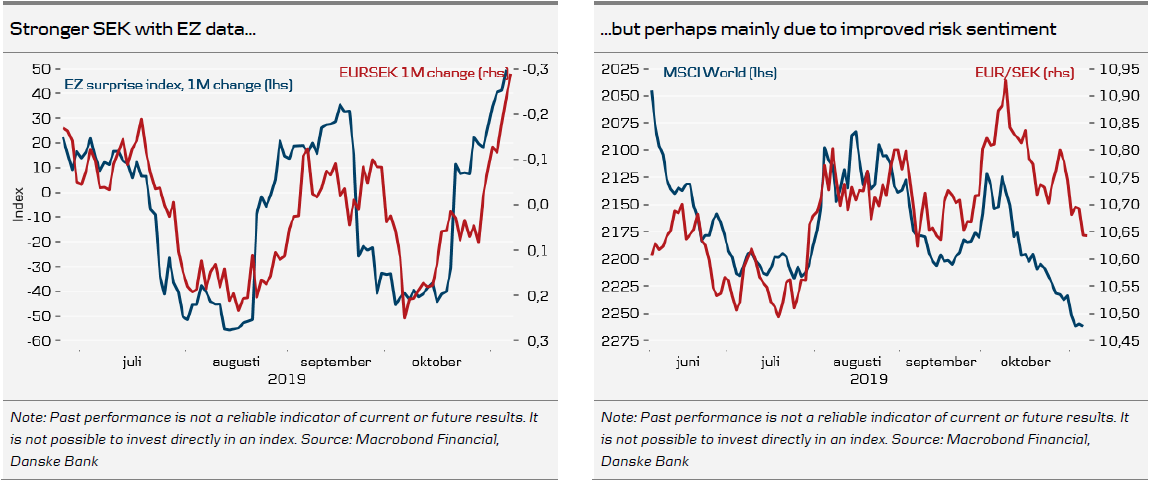
On that note, looking for it one could actually find some positive (or rather less negative) signs, e.g. composite PMI and retail sales in the EZ. It is too early to tell whether this marks the turnaround in the EZ cyclical outlook, but it is not entirely far-fetched for the market to fixate on these green shoots and if so the high-beta SEK often comes out on top (see figure below). In addition, risk appetite amid ‘good news’ regarding the trade talks has infused optimism to stock markets and has been a driver in FX. The SEK, NOK, CAD, AUD and NZD have been winners during last month’s equity rally, whereas the JPY and CHF have underperformed. If this optimism prevails, the SEK could strengthen further.
To sum up. We still see both the Swedish and the global cyclical outlook as a headwind for the SEK. Additionally, we believe that the Riksbank will continue to have a hard time reaching the inflation target and that the SEK will continue to act as a valve. At the same time, we have revised our forecast on the Riksbank and we no longer see a rate cut in early 2020 but instead accepted that rates are likely to be raised in December. After the December hike, however, we deem it more likely that the next move will be a cut rather than a hike, which in time should be discounted in the SEK. On the other hand, global risks have subsided somewhat lately. Overall, we still believe there to be additional upside in EUR/SEK, but the latest developments have pushed us to review the levels. Therefore, we choose to revise down our forecast profile by 20 figures over the whole horizon: 1M 10.70 (10.90), 3M (NYSE:MMM) 10.80 (11.00), 6-12M 11.00 (11.20).
Open Strategies
