Get 40% Off
🚨 Volatile Markets? Find Hidden Gems for Serious OutperformanceFind Stocks Now

Rally Slows But Not Dead

Published 03/30/2017, 12:21 AM
Updated 07/09/2023, 06:31 AM

The Swing Low continues to play out with small gains in lead markets. There is still resistance in play, but this supply is been consumed by the day. Trading volume was light too.

The S&P is at resistance from the March swing low, but Wednesday's gain did little to get past this. Stochastics are bullish, but other technicals are negative and the last two days of trading didn't change this. While bears may think there is an angle to work, the most likely outcome is for a gain which returns a challenge of 2,400.
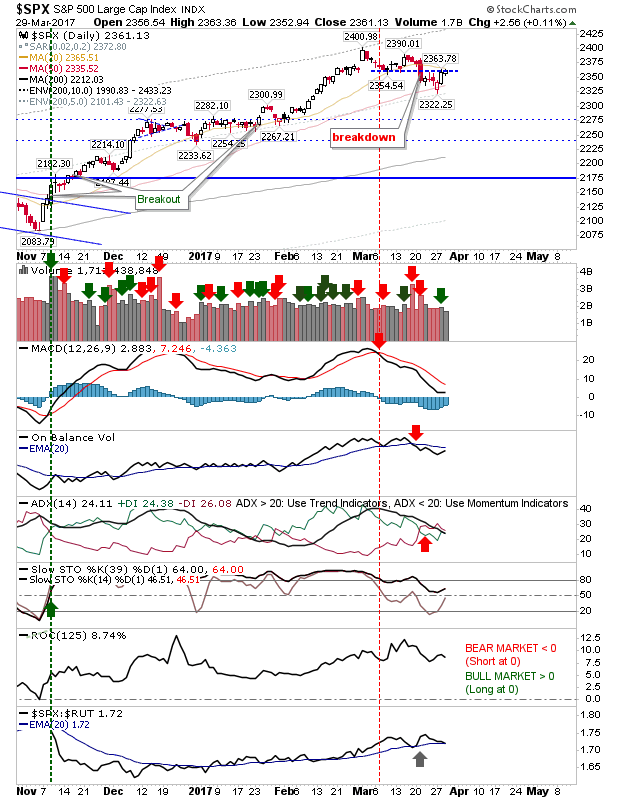
SPX Daily Chart


Unlike the S&P, the NASDAQ has managed to get past this March-level resistance and only has 5,928 to break before confirming new all-time highs. The MACD has been pushing a 'sell' trigger since March, but Stochastics and On-Balance-Volume have been very strong since the election. The rally just above the 50-day MA has helped too. Buyers look ready for more which would deliver a fresh 'buy' trigger above the bullish zero line.
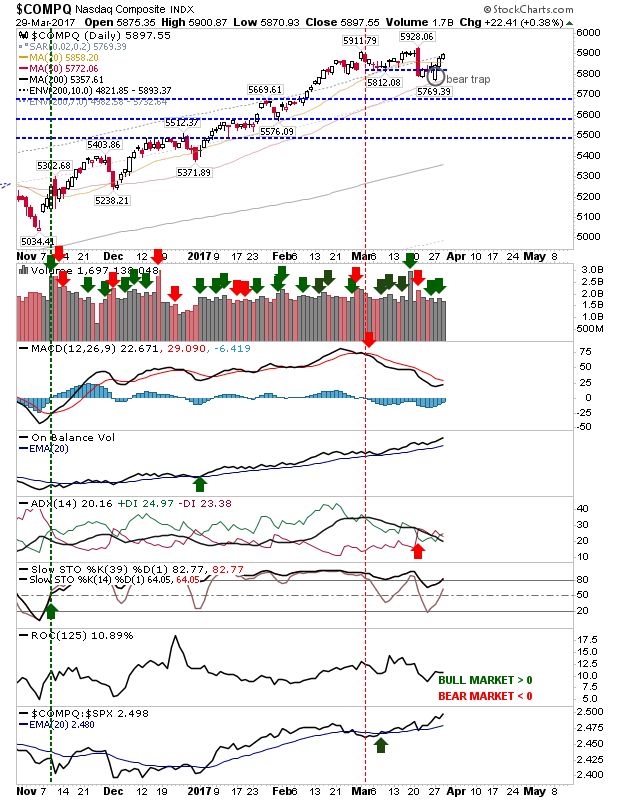
COMPQ Daily Chart


The Russell 2000 also got past March swing low resistance, but it hasn't the technical strength like the NASDAQ. The presence of converged 20-day and 50-day MAs adds to the trouble as resistance. If there was an undercut of the March swing low (for a second time) it would convert the 'bear trap' from last week into a 'bull trap' and open up for a move back to the 200-day MA. Shorts best opportunity looks to be here.
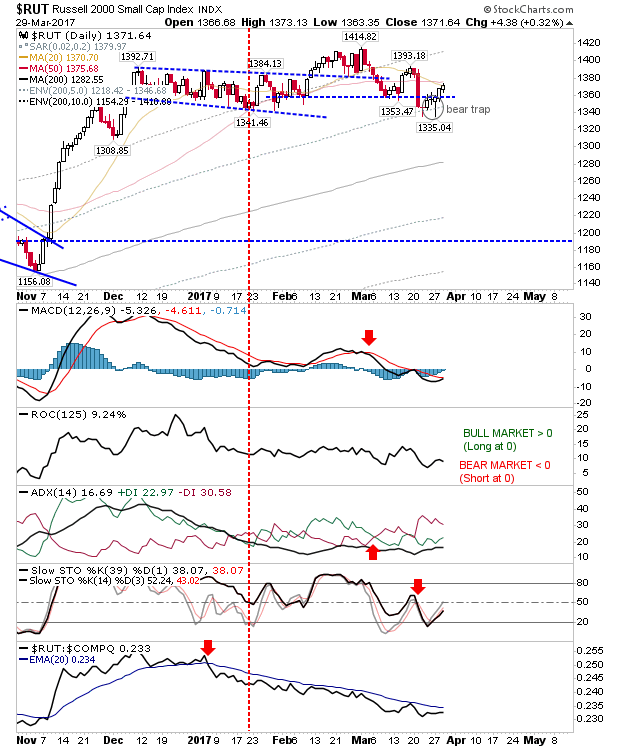
RUT Daily Chart


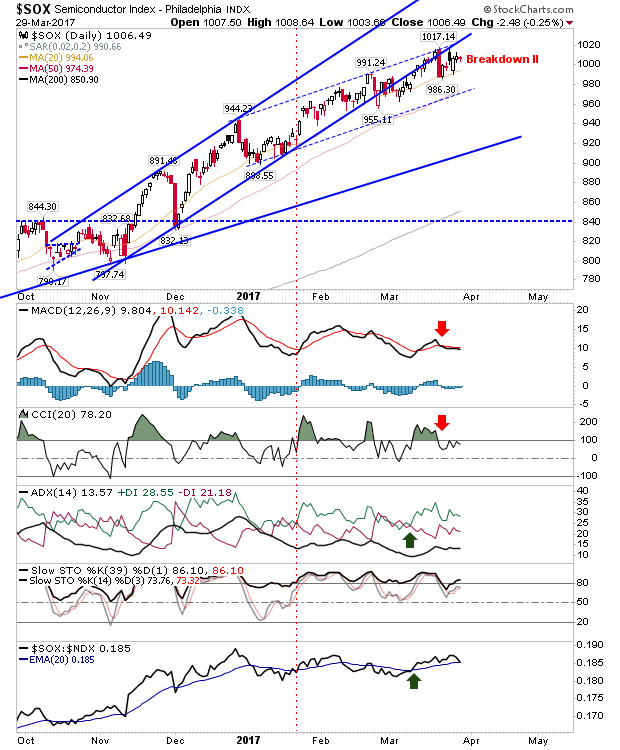
The other index to watch the Semiconductor Index. It has fallen outside of the rising channel generated by the election, but a new upward channel may be taking shape. Confirmation is needed, with a move to tag the thin hashed blue line, but if this doesn't hold, then the rising blue line from the November swing low is an alternative.
3rd party Ad. Not an offer or recommendation by Investing.com. See disclosure here or remove ads .

SOX Daily Chart


For Thursday, the S&P is best set up for bulls, but shorts can take a look at the Russell 2000

Latest comments

Risk Disclosure: Trading in financial instruments and/or cryptocurrencies involves high risks including the risk of losing some, or all, of your investment amount, and may not be suitable for all investors. Prices of cryptocurrencies are extremely volatile and may be affected by external factors such as financial, regulatory or political events. Trading on margin increases the financial risks.
Before deciding to trade in financial instrument or cryptocurrencies you should be fully informed of the risks and costs associated with trading the financial markets, carefully consider your investment objectives, level of experience, and risk appetite, and seek professional advice where needed.
Fusion Media would like to remind you that the data contained in this website is not necessarily real-time nor accurate. The data and prices on the website are not necessarily provided by any market or exchange, but may be provided by market makers, and so prices may not be accurate and may differ from the actual price at any given market, meaning prices are indicative and not appropriate for trading purposes. Fusion Media and any provider of the data contained in this website will not accept liability for any loss or damage as a result of your trading, or your reliance on the information contained within this website.
It is prohibited to use, store, reproduce, display, modify, transmit or distribute the data contained in this website without the explicit prior written permission of Fusion Media and/or the data provider. All intellectual property rights are reserved by the providers and/or the exchange providing the data contained in this website.
Fusion Media may be compensated by the advertisers that appear on the website, based on your interaction with the advertisements or advertisers.
© 2007-2024 - Fusion Media Limited. All Rights Reserved.