
- Review & Update
- Is The Bear Market Over?
- Interest Rates At A Critical Juncture
- Sector & Market Analysis
- 401k Plan Manager
This week is a review of where we have been and a look forward as to what may happen next.
First, let’s rewind the tape to the beginning of March.
“Most importantly, the market is currently in the process of building a consolidation pattern as shown by the ‘red’ triangle below. Whichever direction the market breaks out from this consolidation will dictate the direction of the next intermediate-term move.”

“Turning points in the market, if this is one, are extremely difficult to navigate. They are also the juncture where the most investing mistakes are made.”
The market did indeed fail to breakout and on March 23rd, as the market first tested the 200-dma for the first time, we laid out the three possible pathways for the market.
I have repeated those options over the last couple of weeks, so click the link above for specific details.
- Option 1: The market regains its bullish underpinnings, the correction concludes and the next leg of the current bull market cycle continues.
- Option 2: The market, given the current oversold condition, provides for a reflexive bounce to the 100-dma and fails.
- Option 3: The market struggles higher to the previous “double top” set in February, retraces back to the 100-dma and then moves higher.

In last weekend’s missive, as the rally approached the 100-dma, we recommended that investors use the rally to take action and rebalance risk in portfolios. We also discussed the benefits of holding extra cash.
“Given the recent rally, and overbought conditions, we are using this rally to follow our basic portfolio management rules. As the market approaches the “neighborhood” of the 100-dma we are:
- Selling laggards and raising cash.
- Rebalancing remaining long-equity exposure to comply with portfolio target weightings
- Rebalancing the total allocation model to comply with target exposure levels. (See 401k plan manager below)”
Chart updated through Friday’s close.

That advice turned out to be warranted (a lucky guess) as the market not only failed at resistance, but has now established a third lower top. That failure also pulls the current downtrend line lower as shown in the chart below. This development should not be lightly dismissed.

This week, we are continuing to carry an overweight position in cash. However, we are monitoring the possible actions heading into next week:
- With the market on a short-term “buy” signal, there remains a potential for another rally attempt next week. If the market can clear the downtrend, then we will be looking for an opportunity to redeploy cash.
- However, the failure at resistance applies more downward pressures to prices in the short-term which keeps risk elevated. Pathway 2 is becoming much more viable if market action doesn’t improve soon.
- Over the next couple of weeks, it is critically important for the market to regain its footing and not break the 200-day moving average which will likely accelerate the correction process.
- Over the next couple of months, with earnings season still in process, volatility will remain a close companion so we will have to continue monitoring changes on a very short-term basis and adjust accordingly.
However, that brings me to the next point.
Corrections Vs. Bear Markets
It was interesting to note last week the number of emails I received, as the market rallied higher, all asking one primary question:
“Is the bear market over?”
The question is interesting from a couple of perspectives.
First, the recent downward slide in markets was only a “correction” and not a “bear market.” Both in terms of the percentage decline as well as the lack of reversion in investor psychology.
If the recent decline had been a “bear market,” the primary question would be “should I sell now,” rather than “should I buy?” What the recent correction failed to do was instill any significant level of “real fear” back into the market. High yield spreads remain compressed, the rise in the volatility index was quickly reversed, and investor attitudes were not changed from “greed” to “fear.”
From an investment perspective, those three ingredients are critical for determining longer-term entry points for taking on more aggressive investment postures. “Buy fear, sell greed.”
However, while the market rallied nicely early last week, as noted above, the rally has yet to reverse the current negative trend in the market. This was also noted by Phil’s Stock World earlier this week:
“As you can see from the chart we’re still making one of those triangle squeezy thingy patterns but the top of the down wedge is still at our 2,740 line and it will be three more weeks of this nonsense (while earnings pour in) until it resolves itself but, with the nose of the triangle lower than where we are now (2,717) – the odds favor the short bet on /ES Futures.“

As Phil correctly notes, the market is being currently supported by excitement over “tax cut” driven earnings growth. However, while the bottom line is being boosted by tax cuts, revenue remains another issue. More importantly, investors should keep in mind the “tax cut” benefit is only good for this year as starting in 2019 we will be to comparing normalized year-over-year earnings growth.
More importantly, the market currently remains on both a short and intermediate term “sell” signal. While those signals could certainly be reversed in the days and weeks ahead, historically, it has often paid to adhere to what those signals are suggesting. (The purple bars are when the MACD line is negative confirming a “sell signal”)
(I penned an article recently on the 200-day moving average and the primary question was “when do you get back in?” So, just to clarify, a “sell signal” suggests reducing risk to equities, when the signal reverses you increase risk to equities. Notice – it is not an “all out” or “all in” thing.)


As noted above, we remain a heavier in cash than normal until the market breaks out of the current downtrend and begins to reverse those signals. If the market breaks below the 200-dma, we will raise more cash and institute further hedges as well.
While holding cash will certainly weigh on short-term performance if the market rallies, I will gladly exchange that for longer-term outperformance by protecting investment capital.
More importantly, the real “bear market” is still coming.
Interest Rates At A Critical Juncture
The bond market may be signaling a more important shift which should not be overlooked. Interest rates have been dismissed by the majority of investors under the premise that as rates rise, money will flow into equities.
While such may be the case early in the investment cycle, in a late-stage economic cycle where rates have risen sharply, the outcome for investors has not been kind. As shown in the chart below, historically speaking such shifts from extreme oversold, as seen in 2016, to extreme overbought conditions in bonds has tended to be linked with more important market events.

Every. Single. Time.
Interest rates have also hit levels to where it is impacting consumption, and will begin to weigh on economic growth. However, rising interest rates alone are one thing, but when combined with sharply rising oil prices, which is a direct drag on consumer spending, it is quite another.
More importantly, the rise in oil prices has all but wiped out any benefit from the “tax cut” bill that consumers would expect to receive. This puts economic growth going forward further at risk as input costs rise to manufacturers which cannot be passed on directly to consumers. As higher input cost erodes profits, companies look to suppress wage growth. See the problem here?
Furthermore, since the rise in oil prices has been a primary driver of the “inflation” story, which has been bolstered by a sharp decline in the U.S. dollar, and rising interest rates, this “triple whammy” puts a rather bleak outlook on forward equity returns.

With both oil prices extremely overbought on a weekly basis, and the dollar exceedingly oversold, it is quite likely a strong reversal will occur. If such is the case, it will coincide with a much broader and deeper correction in the financial markets.
Sure, this time could be different. It just historically hasn’t been.
Is a “bear market” emerging? There is absolutely a case that one could be and the outcomes of such are not palatable to long-term financial goals.
Yes, this could all pass by very quickly and the bull market could surge back to life.
But what is your plan if it doesn’t?
As I noted previously, missing out on a rally in the market is extremely easy to make up. Recouping lost capital is an entirely different matter.
Let’s see what happens next week.
Market & Sector Analysis
Data Analysis Of The Market & Sectors For Traders
S&P 500 Tear Sheet

Performance Analysis

ETF Model Relative Performance Analysis

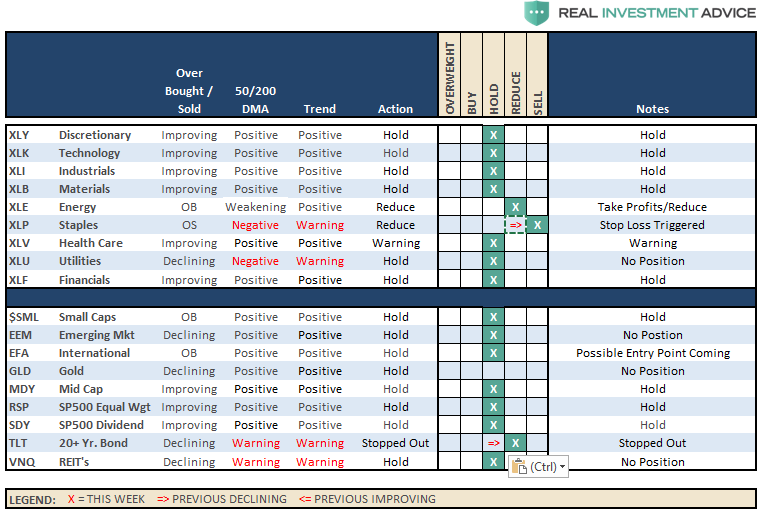
Sector & Market Analysis:
On a very short-term basis, the market registered a trading “buy” signal. However, with the market still on longer-term “sell” signals, below important resistance and still contained in a downtrend, this rally should be used to raise cash rather than take on additional risk.

Discretionary, Technology, Materials, and Industrials rallied back sharply over the last two weeks, but have now established a third top in a downtrend channel. We recommended using the rally to rebalance sectors to portfolio weights but remain long. That advice remains currently. With earnings season starting, these sectors are the best positioned to benefit from positive surprises but will still be driven by the direction of the broader market.
Financials and Health Care recovered recently, but are lagging on a relative performance basis. Health Care, in particular, remains weak. Remain underweight these sectors currently until performance improves.
Energy – after consolidating for over a month, energy stocks spurted higher over the last couple of weeks as oil prices ramped up on prospects of an engagement with Syria. The spurt in oil prices has been pushed higher as shorts have been forced to cover. With oil now back to extremely overbought, and at levels which have repeatedly denoted peaks in prices, take profits in this sector and rebalance back to portfolio weight. A fairly healthy correction is needed for an opportunity to increase exposure.
Staples – has completely fallen apart after a rally back to the 50-dma. The sector has also taken out recent lows suggesting an elimination of the holdings. Importantly, this sector speaks much more broadly about the real health of the economy. Pay attention to the message.
Utilities have significantly picked up performance in recent weeks and have broken back above the 50-dma. We are not recommending adding to the position yet as the moving-average crossover remains negative. However, the 50-dma is beginning to improve. A retracement back to the 50-dma that holds will provide a trading opportunity.

Small Cap, Mid Cap, and International indices all pushed back above their 50-dma last week. While the performance improved last week, be careful getting overly aggressive at this juncture. Small caps have potentially put in a triple top, Mid-cap is continuing to build a downtrend as well as International. Remain patient at the moment.
Emerging Markets are still struggling. We previously removed our holdings in this sector and remain flat currently. We will continue to monitor performance for improvement.
Dividends and Equal weight continue to hold their 200-dma. We continue to hold our allocations to these “core holdings,” but are closely monitoring performance. The continued development of a downtrend channel is concerning.
Gold continues its volatile back-and-forth trade but remains confined below a massive level of multi-top resistance. As of this past week, Gold failed another test of recent highs. We currently do not have exposure to gold, and have been out for a long-time, but if you are already long the metal hold for now. $120 on GLD (NYSE:GLD) is a hard stop.

Bonds and REITs over the last three of weeks, these two sectors looked to have bottomed and initiated early “buy” signals. We are raising cash by reducing REIT’s to give some clearance to portfolios for earnings season, but will be quick to add back the exposure if performance improves. We were stopped out of bond trading position for now.
The table below shows thoughts on specific actions related to the current market environment.
(These are not recommendations or solicitations to take any action. This is for informational purposes only related to market extremes and contrarian positioning within portfolios. Use at your own risk and peril.)
Portfolio/Client Update:
As we several weeks ago, the expectation for a rally occurred. This past week, the rally failed at our targeted resistance level. With cash levels currently higher than normal, we are already well positioned for whatever happens next. While we continue to honor the current “bullish trend,” we remain very aware of the rising risks and continue to look for opportunities to derisk and re-hedge portfolios while “sell signals” remain firmly intact.
The recent rally has been extremely week and lacked real conviction. However, if the market can break above the current downtrend channel on heavy volume, confirming a breakout, we reallocate and rebuild portfolio models accordingly.
For the moment, we are just letting the markets determine the best course of action and we continue to raise cash on technical breakdowns. Our bigger concern, remains the relative risk to capital if the 9-year old bull market is ending. If the current correction expands into a more meaningful reversionary process, we will become much more aggressively risk adverse. There is plenty of evidence to support the latter case.
It is crucially important the market maintains the current uptrend from the recent lows. After having reduced exposure a couple of weeks ago, we remain on alert for the next opportunities.
We remain keenly aware of the intermediate “sell signal“ which has now been “confirmed” by the recent market breakdown. We will continue to take actions to hedge risks and protect capital until those signals are reversed.
THE REAL 401k PLAN MANAGER
The Real 401k Plan Manager – A Conservative Strategy For Long-Term Investors

There are 4-steps to allocation changes based on 25% reduction increments. As noted in the chart above a 100% allocation level is equal to 60% stocks. I never advocate being 100% out of the market as it is far too difficult to reverse course when the market changes from a negative to a positive trend. Emotions keep us from taking the correct action.

Market Fails At Resistance
As I wrote last week, the “reflexive rally” to reduce exposure finally got into the “neighborhood” of our initial target area that we laid out nearly a month ago. The market failed at that target on Friday which confirms the reduction measures we laid out previously.
If you have not already taken action in your 401-k plan, I would advise moving to target allocations next week and mitigating risk temporarily. With both confirmed “sell signals” in place, the risk to equity exposure currently remains to the downside. If conditions improve we will rebalance equity risk in portfolios back to full allocations but a LOT has to happen first.
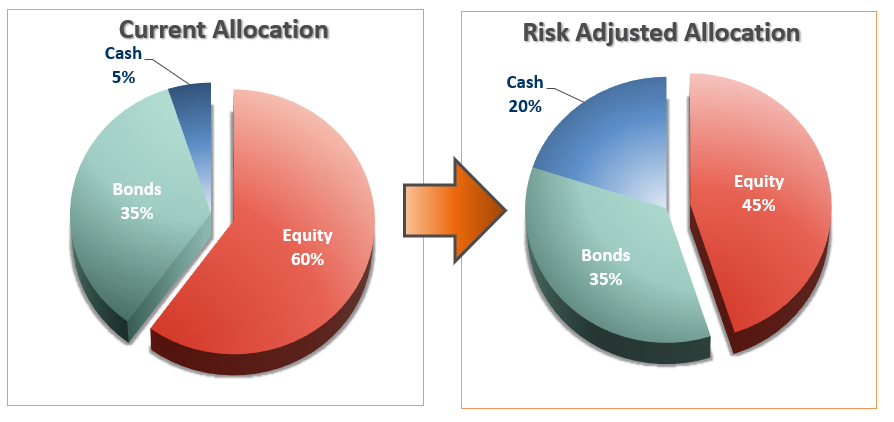
If you have already reduced equity exposure just sit tight this week and let’s see what happens.