Short-term interest rates have been relentlessly rising since the second half of 2015. For example, 3-month LIBOR was 0.28% in July of that year. It is now 1.7%. This is just a result of the Fed centrally planning our economy, managing our interest rate for us.
Long-term rates have not moved. The 10-Year Treasury Yield in July 2015 was 2.5%. It is now … 2.5%.
The direct result of this is to compress the profit margins of banks. Banks borrow short to lend long—they may borrow at LIBOR to buy 10-year Treasurys. What had been a nice trade grossing 2.5 – 0.28 = 2.2% has been deflated to 2.5 – 1.7 = 0.8%. That’s the gross profit, but the net is less than that due management and other costs.
At the same time, the euro has gone from $1.11 to $1.20, the pound has gone from $1.56 to $1.36, and the Chinese yuan has gone from $0.16 to $0.15.
Copper has risen from $2.63 to $3.24, oil has incremented from $58.98 to $61.63, and wheat has dropped from $5.80 to $4.30.
To Wall Street, these data (and others I did not cite) signal good times because the economy is robust to Fed normalization (whatever that means), risk-on assets are rising, and inflation is tame with food going down, oil stable, and copper (aka “Dr. Copper, the metal with the PhD™) going up to prove that the economy is healthy. Oh and now we have a Republican president, so that confirms it.
However, not everyone agrees. To many in the gold community, we are overdue for inflation with a vengeance because the money supply grew so rapidly after the crisis of 2008, because Uncle Sam is abusing his credit (no comment on what other governments are doing), and look at copper. And oil. And the world is going to dump the dollar.
It should come as no surprise that we disagree with the Wall Street party line. Wall Street is talking their book, not to mention overjoyed that they can continue to borrow to own assets that only go up. The Dow Jones Industrial Average recently topped 25,000 dontyaknow?? If assets go up, but consumer prices do not, then the purchasing power of your wealth is rising. Upon liquidation, you could buy more groceries (and BMW’s) than ever!
We also disagree with many in the gold community. We think they are still waiting for the Great Pumpkin to come to the pumpkin patch, like on the Charlie Brown Halloween Special. Inflation is gonna come sooner or later, dontaknow?
They cite the dollar index. However, we do not believe that the dollar can be measured by its derivatives—the euro, pound, and yuan are derivatives of the dollar. That makes no more sense than measuring gold in terms of the dollar, or measuring the meter stick in terms of rubber bands. It’s exactly backwards. The dollar must be measured in gold. The dollar was 26.6 milligrams gold back in July 2015, and now it is 23.6, a drop of 3mg. So it has gone down, though of course here the gold community sees upside. Gold has moved up, dontyaknow?
Anyways, back to that move of the dollar index, which has gone down from 95.5 to 92. This shows that the world wants to sell all their dollars, dontyaknow? And of course, this means only one thing. Gold is finally going up, to the moon. That number again, is 1-800-GET-YOUR-GOLD-HERE-BEFORE-YOU-CANT!
Whether or not the price of gold goes up—we have recently shown a quantum step up in gold demand—the above analysis is wrong. You can measure a dollar derivative in dollars, such as the euro. We think it is appropriate to say the euro jumped from $1.11 to $1.20 or the yuan has dropped from $0.16 to $0.15. They’re derivatives, and they can be expressed in terms of the underlying dollar.
But you cannot measure the dollar in terms of these dollar-derivatives.
We interpret things differently. We see rising short-term rates, long Treasury yields not rising, and the rate paid by junk borrowers declining. Combine this with rising stocks and a rising euro. Add in rising debt at nonfinancial corporations, up over 10% since July 2015. Mix with rising consumer debt, which is up 8%. We see a boom. A classic borrow-to-spend and drive up GDP and employment while it lasts boom. A regular rising-risk-assets boom.
We see people eating more of the seed corn.
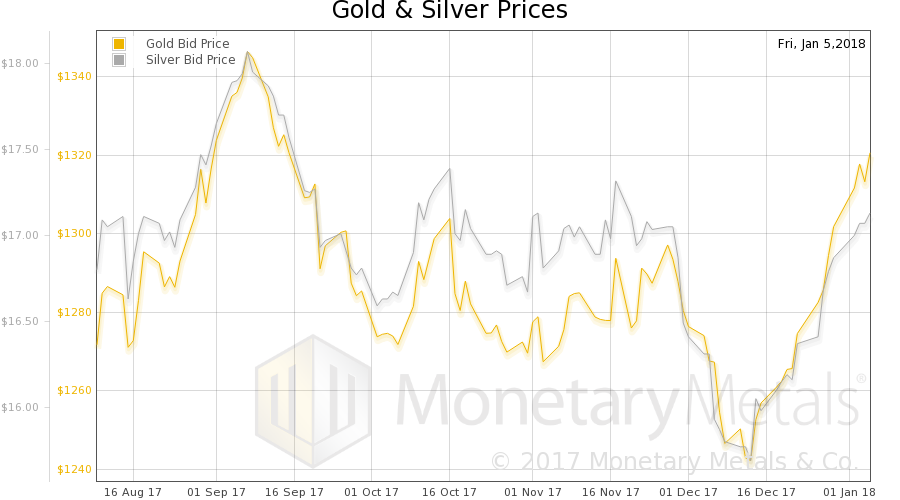
In this New Year’s holiday shortened week, the price of gold moved up again, another $16 and silver another 29 cents. Or in light of the above discussion, we should say the dollar moved down 0.03mg gold and 0.03 grams silver. It will make those who borrow to short the dollar happy…
Let’s take a look at the only true picture of the supply and demand fundamentals for the metals. But first, here are the charts of the prices of gold and silver, and the gold-silver ratio.

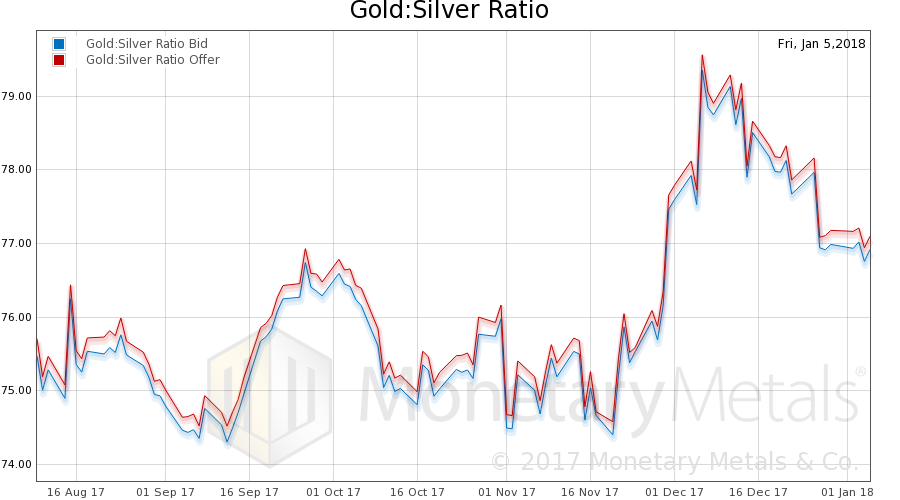
Next, this is a graph of the gold price measured in silver, otherwise known as the gold to silver ratio. The ratio dropped.

In this graph, we show both bid and offer prices for the gold-silver ratio. If you were to sell gold on the bid and buy silver at the ask, that is the lower bid price. Conversely, if you sold silver on the bid and bought gold at the offer, that is the higher offer price.
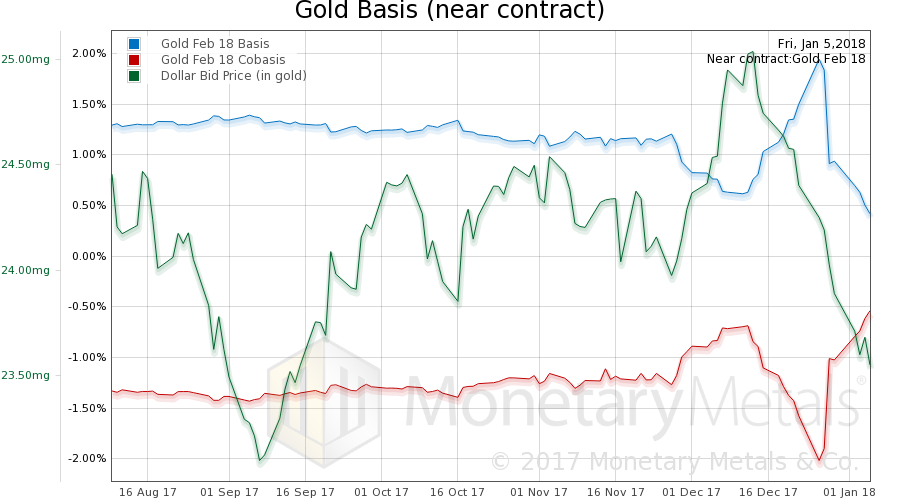
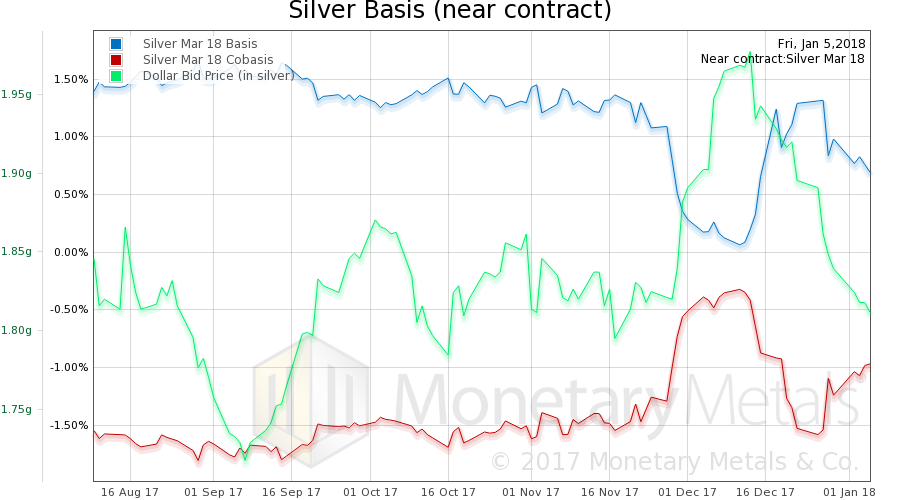
For each metal, we will look at a graph of the basis and cobasis overlaid with the price of the dollar in terms of the respective metal. It will make it easier to provide brief commentary. The dollar will be represented in green, the basis in blue and cobasis in red.
Here is the gold graph showing gold basis and gold price.

Look at that quantum change after Christmas. The basis (i.e. abundance) had peaked, and the cobasis (i.e. scarcity) had bottomed. Up until it reversed, those moves were tracking the price. As the price of gold was rising (the green line shows the inverse, the price of the dollar!) gold was becoming more abundant, less scarce.
But after Christmas, something snapped. Gold started to become less abundant as its price is rising. This violates no economic law, though it has been a rare occurrence of late. Until Christmas week.
It should be no surprise that our Monetary Metals Gold Fundamental Price rose $29 this week, to $1,336.
Now let’s look at silver.

The same pattern occurs here, though more muted. This is a bit unusual, as price and basis moves tend to be bigger in silver due to this metal’s lesser liquidity.
