
Quaker Chemical Corporation (NYSE:KWR) logged a profit (attributable to the company) of $15.2 million or 86 cents per share in the fourth quarter of 2019, up from a profit of $7.8 million or 58 cents a year ago.
Barring one-time items, earnings came in at $1.34 per share for the reported quarter, down from $1.54 a year ago. It, however, surpassed the Zacks Consensus Estimate of $1.29.
Net sales surged 85% year over year to roughly $391.3 million in the quarter. It also topped the Zacks Consensus Estimate of $382.5 million. Revenues were boosted by additional sales associated with the company's combination with Houghton International, Inc and the acquisition of the operating divisions of Norman Hay plc.
Quaker Chemical Corporation Price, Consensus and EPS Surprise
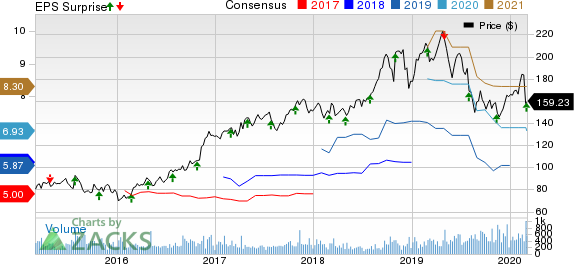
Quaker Chemical Corporation price-consensus-eps-surprise-chart | Quaker Chemical Corporation Quote
Margins
The company’s gross profit in the reported quarter climbed 82% year over year on the back of sales related to Houghton and Norman Hay. Gross margin for the quarter was 34.8%, down from 35.4% a year ago. Gross margin includes $1.5 million of expense related to the sale of Norman Hay's acquired inventory during the reported quarter.
Adjusted EBITDA was $60.6 million for the reported quarter, more than doubling from $29.7 million in the prior-year quarter.
FY19 Results
Profits for 2019 were $31.6 million or $2.08 per share, down from $59.5 million or $4.45 a share recorded in 2018. Adjusted earnings were $5.83 per share, down from $6.17 per share a year ago.
Revenues for the year climbed around 31% year over year to $1,133.5 million. It includes additional sales of $319.4 million from Houghton and Norman Hay.
Financials
The company ended 2019 with cash and cash equivalents of around $123.5 million, up roughly 19% year over year. Long-term debt was $882.4 million, up from $35.9 million a year ago.
Net operating cash flow for 2019 was $82.4 million, up around 5% from $78.8 million in 2018.
The company paid dividend worth $21.8 million to its shareholders during 2019, up 13% year over year.
Outlook
The company noted that coronavirus and Boeing (NYSE:BA)'s move to temporarily stop production of the 737 Max have put more uncertainty than normal in its ability to forecast for 2020.
The company expects that coronavirus and reduced 737 Max production may impact its adjusted EBITDA by roughly $10 million and $6 million, respectively, in 2020. However, it remains confident in its ability to deliver strong adjusted EBITDA growth this year notwithstanding the market uncertainties.
For 2020, the company expects to deliver around $30 million or more of adjusted EBITDA growth over its pro forma adjusted EBITDA of $234 million for 2019. This is expected to be mainly driven by a full year of Norman Hay, synergy benefits and additional market share gains that more than offset the anticipated headwinds from coronavirus and lower 737 Max production.
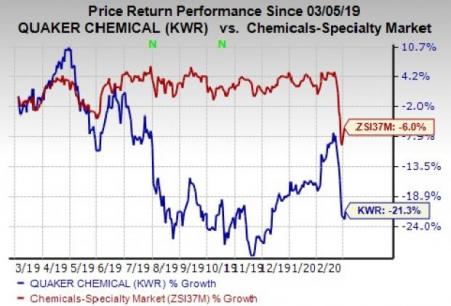
Price Performance
The company’s shares are down 21.3% over a year, compared with the 6% decline recorded by its industry.
Zacks Rank & Stocks to Consider
Quaker Chemical currently carries a Zacks Rank #4 (Sell).
Some better-ranked stocks in the basic materials space include Daqo New Energy Corp. (NYSE:DQ) , NovaGold Resources Inc. (NYSE:NG) and Commercial Metals Company (NYSE:CMC) .
Daqo New Energy has projected earnings growth rate of 353.7% for 2020 and sports a Zacks Rank #1 (Strong Buy). The company’s shares have rallied roughly 74% in a year’s time. You can see the complete list of today’s Zacks #1 Rank stocks here.
NovaGold has projected earnings growth rate of 11.1% for the current fiscal and carries a Zacks Rank #2 (Buy). The company’s shares have surged around 117% over a year.
Commercial Metals has estimated earnings growth rate of 21.6% for the current fiscal and carries a Zacks Rank #2. The company’s shares are up roughly 9% in a year’s time.
Today's Best Stocks from Zacks
Would you like to see the updated picks from our best market-beating strategies? From 2017 through 2019, while the S&P 500 gained and impressive +53.6%, five of our strategies returned +65.8%, +97.1%, +118.0%, +175.7% and even +186.7%.
This outperformance has not just been a recent phenomenon. From 2000 – 2019, while the S&P averaged +6.0% per year, our top strategies averaged up to +54.7% per year.
See their latest picks free >>
Commercial Metals Company (CMC): Free Stock Analysis Report
Quaker Chemical Corporation (KWR): Free Stock Analysis Report
DAQO New Energy Corp. (DQ): Free Stock Analysis Report
Novagold Resources Inc. (NG): Free Stock Analysis Report
Original post
Zacks Investment Research