I have made my short term bearish case for the QQQs in the past two weekly reports. I think the US market is set-up for a crack. The bull market may not be over, as conditions allow for another run to higher highs after a shake-out, but for now we’re walking on eggshells.
First off, Rambus has made it clear that there is still no resolution in the QQQ. We have bounced off the NL of a potential H&S pattern therefore no sell signal from a price perspective has been triggered. As mentioned however, sometimes I get out a bit further on my skis and this is a case of this. So with a note of caution, I would like to show you what I am seeing.
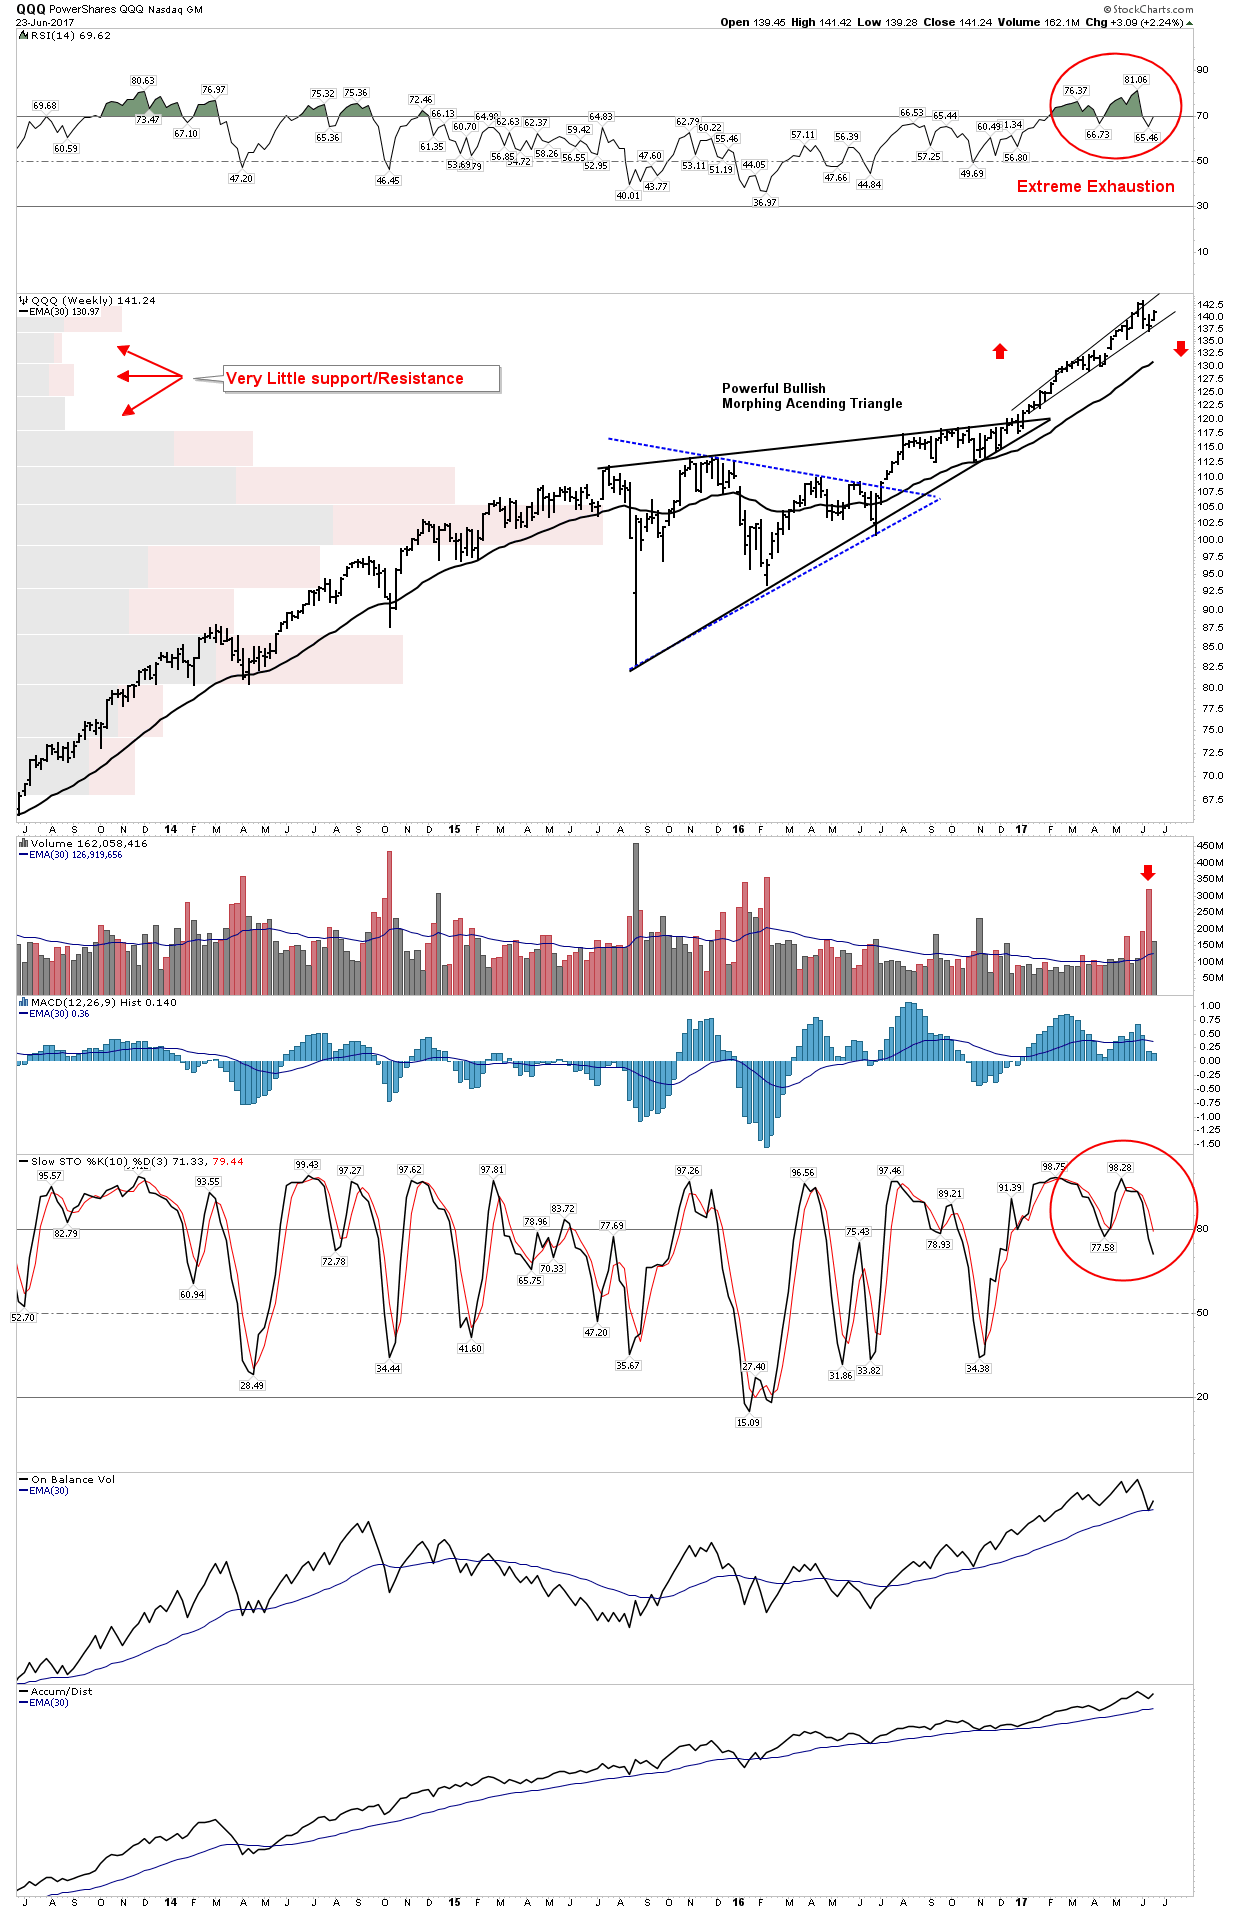
Below we see a 4-year weekly view of the QQQ. It shows a powerful move upward where it underwent a mid-course triangle consolidation. The move was so powerful that we see how it morphed from a horizontal triangle into an ascending triangle. That was a big clue of what was to come.
After the breakout we see a mania-power-run leaving tiny volume-by-price bars in its trail. It went on to top (for now) at a weekly RSI of 81.06. This is simply extraordinary. We then put in a volume spike-outside reversal to the downside associated with an upside exhaustion. I mentioned earlier that this has not occurred since March 2000 at the peak of THAT mania. So I see the potential for a downside crack in the market right here. Call it the shakeout before the breakout.
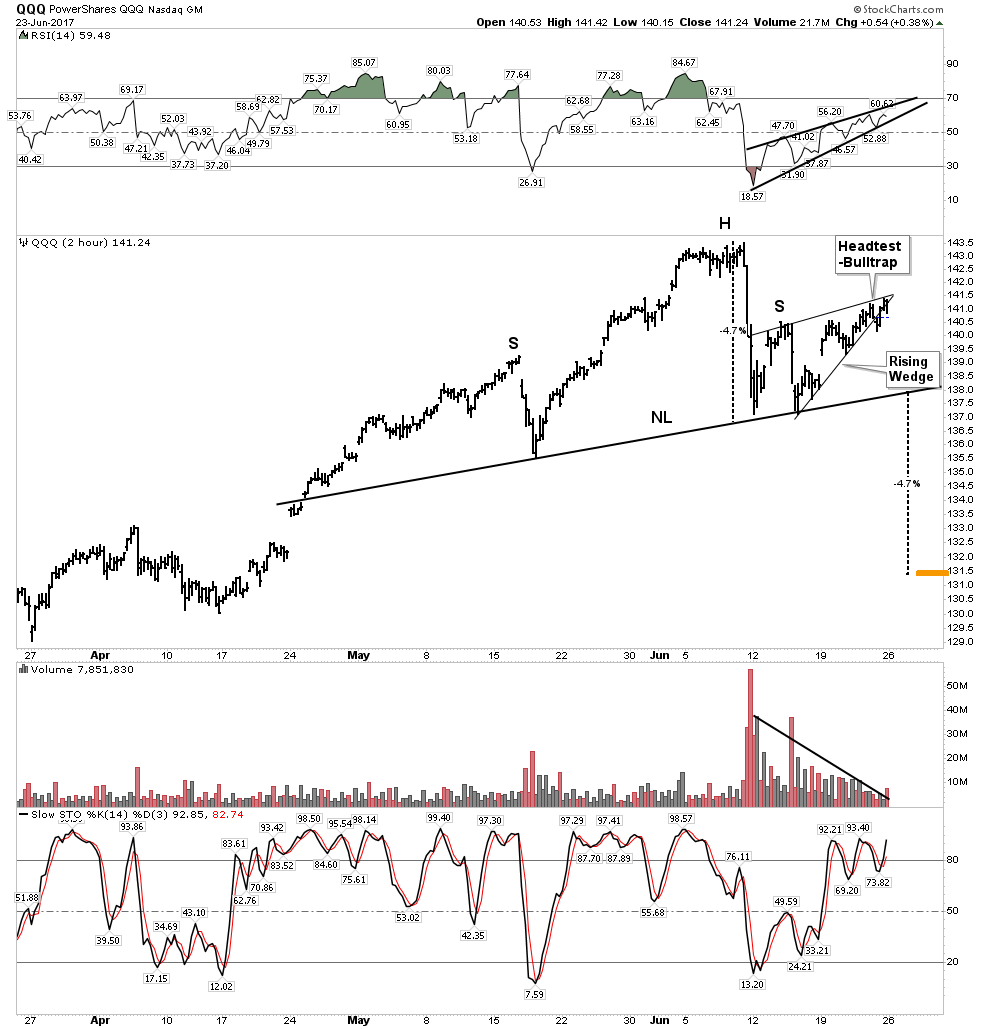
Let’s dive in a little deeper and examine the internals which show what I am seeing. Below is how I interpret the price action. It’s all pretty classic and consistent with bounce dynamics. We see bearish rising wedges all over. In the RSI and price action it looks like a dead cat bounce (DCB). Volume decay supports this view as there is no longer enough interest to support a higher move to a new high for now. If the NL is broken we see a MM down to 131.5. All pretty vanilla standard interpretation.
On Balance Volume
So now let’s give a bit more deeper insight: Volume analysis. Joe Granville, the great one, gave us his on balance volume (OBV). He had an epiphany and saw it one day as a valuable way to view volume accumulated. In a similar fashion Dick Arms one day walked into the stock exchange, looked at the board and it struck him…the “Arm’s Index” was created. (look it up). It just hit him.
So, OBV is a running summation of up minus down volume. A simple concept actually, easy to see how its a great measure of bull vs bear internal action. If the market is moving up it would make sense that there is more up vs down volume. If not, something is obviously wrong. Which by the way was another Granville truism: “What is obvious, is obviously wrong”
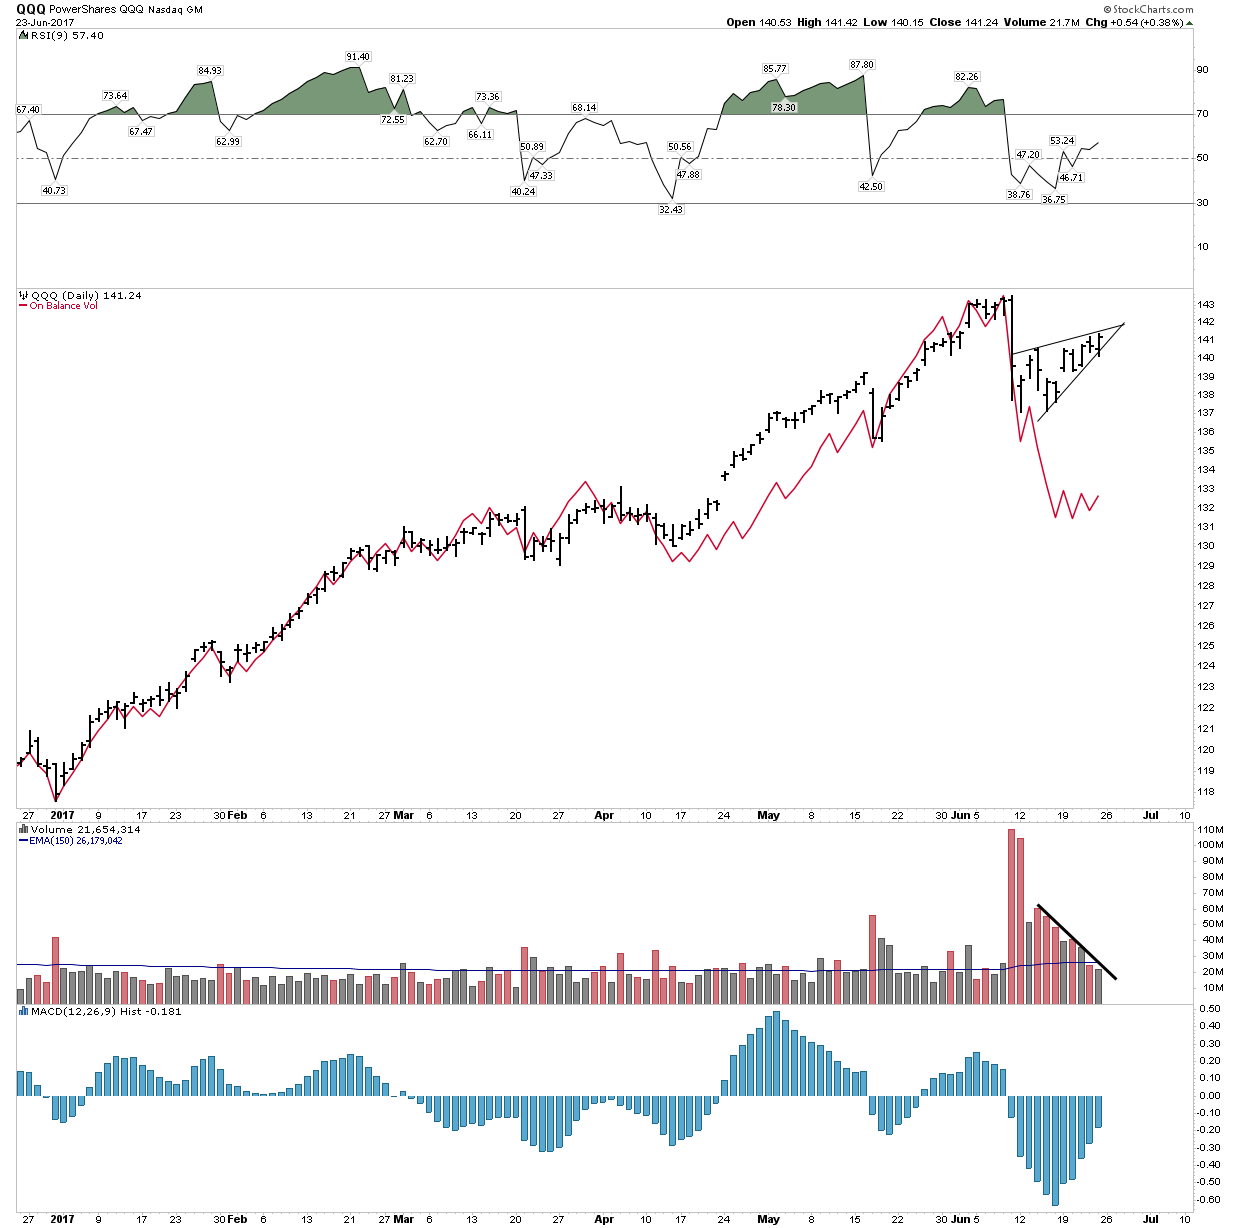
So here we see OBV with the red line over price. Talk about obvious… there is something wrong here. Price has risen on declining OBV. This is called a divergence. I would say its announcing this bounce is built on borrowed time:
Momentum
Let’s now get the “feel” of momentum. Step back a bit and look at this chart from a distance.
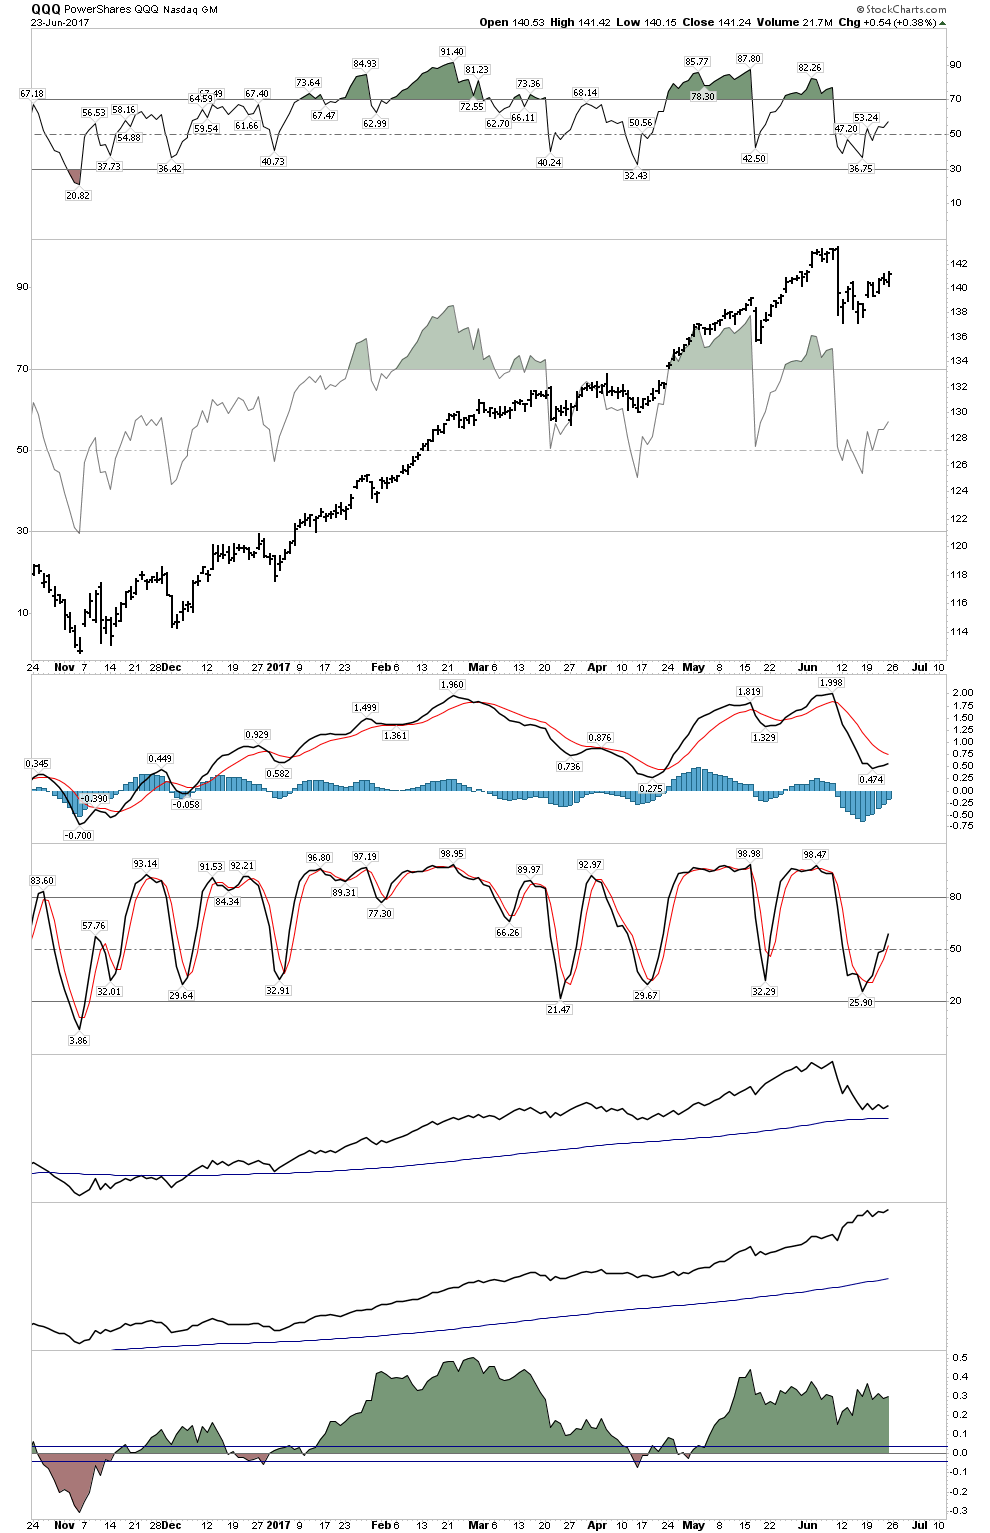
RSI is a level of overbought and oversold. It also expresses momentum. I have superimposed RSI on top of price to drive home my point.
Put yourself in a car riding up the price bars while observing the RSI peaks. Get the feel of how the movement upward is starting to feel exhausted. Note how the last peak just couldn’t get that RSI level up there anymore.
Furthermore, this recent dead cat bounce virtually just sat there. Now look down at the MACD histograms, they can’t even get above zero…Stochastics are substandard as well. This paints a confirming picture of exhaustion.
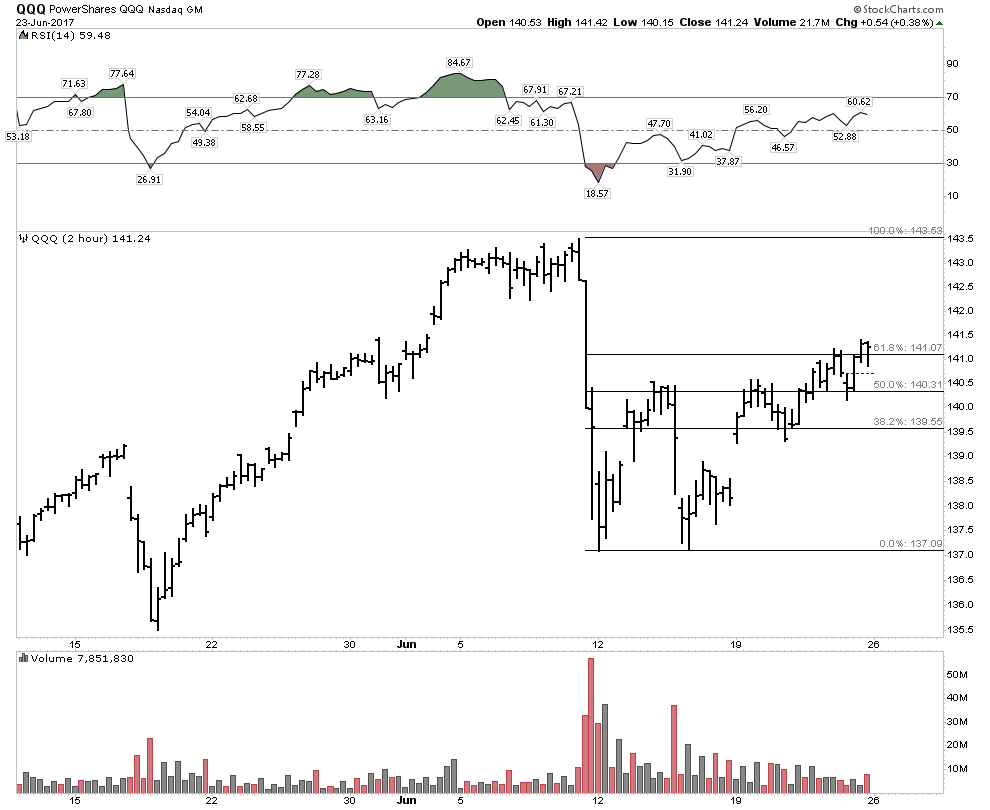
Mr. Fibonacci sez Prego….almost
We have virtually a perfect 61% retracement of the move down:
The Hindenburg Omen
The Hindenburg Omen (HO) does not mandate any specific outcome will happen, but its a statistical data point that gives us insight to a forward path. We just registered a confirming second HO this week. There has never been a crash without a HO.
Here are the statistics over the past 29 years after a confirmed HO:
- 24%- Major Crash
- 39% chance 10-15% decline
- 54% chance 8-10% decline
- 77% chance 5-8% decline
- 92% chance 2-5% decline
- 7% chance of a total miss
So I just wanted to present to you some analysis of these two markets. I certainly don’t “know” what happens next, but you should be familiar with these potential outcomes.
