
QEP Resources, Inc. (NYSE:QEP) incurred a net loss of 10 cents per share in the fourth quarter, primarily due to weak commodity price realizations. The Zacks Consensus Estimate was of a profit of 6 cents per share. Precisely, this upstream player’s oil price realization of $51.36 per barrel missed the Zacks Consensus Estimate of $54.
However, QEP Resources’ loss narrowed from the year-ago quarter’s adjusted loss of 13 cents on the back of higher output from the Permian play.
Quarterly revenues of $321.9 million lagged the Zacks Consensus Estimate of $329 million. Moreover, the top line deteriorated sharply from the year-ago figure of $410.5 million.
Volume Analysis
Production of crude and natural gas totaled 8,465.3 Mboe (67% oil and condensate), down 27% from the year-ago figure, primarily reflecting the sale of Haynesville/Cotton Valley and Uinta Basin assets. Further, lower activity levels in the Williston Basin caused an 11% reduction in volumes from the region.
Natural gas volumes substantially plunged 70% year over year to 8.5 billion cubic feet (Bcf) while natural gas liquids output improved 17% to 1,391.2 thousand barrels (Mbbl). Meanwhile, oil volumes declined from 5,749.9 Mbbl in fourth-quarter 2018 to 5,653.9 Mbbl in the quarter under review.
However, with the company’s focus shifted to the Permian Basin, equivalent production from the area rose 17% year over year to a record 5,113.4 Mboe. Investors should know that QEP Resources allocated bulk of its 2019 capital budget to this lucrative basin as it aims at transforming itself into a Permian pure play.
Realized Prices
QEP Resources’ net realized natural gas price in the quarter was $1.53 per thousand cubic feet, down 43% from the year-ago level of $2.69. The realized price also lagged the Zacks Consensus Estimate of $1.81 per Mcf of gas. Net oil price realization fell 5% year over year to $51.36 per barrel and was also below the Zacks Consensus Estimate of $54 per barrel. Finally, net NGLs price realization plummeted 47% from the fourth quarter of 2018 to $10.22 per barrel and also missed the Zacks Consensus Estimate of $10.63.
QEP Resources, Inc. Price, Consensus and EPS Surprise
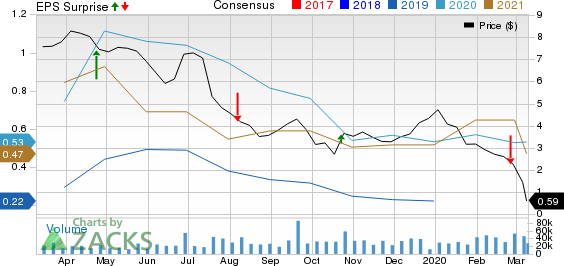
QEP Resources, Inc. price-consensus-eps-surprise-chart | QEP Resources, Inc. Quote
Costs, Capex and Balance Sheet
Total operating expenses in the quarter decreased significantly to $274.4 million from $1,525.6 million a year ago. Capital investment — excluding acquisitions — decreased 44% year over year to $105.5 million in the fourth quarter, mainly due to a fall in completion activities in the Permian Basin. Importantly, reining in costs helped QEP Resources generate $56.2 million in free cash flows in the fourth quarter.
As of Dec 31, QEP Resources had $166.3 million in cash and cash equivalents. The company’s long-term debt was $2,015.6 million, representing a debt-to-capitalization ratio of 43.1%.
2020 Guidance
For first-quarter 2020, QEP Resources expects total oil-equivalent production in the range of 7.6-7.9 million barrels of oil equivalent (MMBoe). Oil and condensate production is forecast within 5-5.1 million barrels (MMBbls). While gas output is envisioned in the 8.2-8.5 Bcf bracket, NGLs production is estimated within 1.3-1.4 MMBbls. Capital outlay for the first quarter is anticipated in the band of $180-$195 million.
For the full year, QEP Resources expects total oil-equivalent production in the range of 31.5-33.7 MMBoe. Oil output is estimated within 21.35-22.45 MMBbls. Gas and natural gas liquids production are anticipated within 31-34 Bcf and 5-5.6 MMBbls, respectively.
The company’s projections for lease operating expenses and adjusted transportation and processing costs are in the band of $5.20-$5.80 per Boe and $3.30-$3.60 per Boe each. QEP Resources predicts general/administrative expenses within $85-$95 million. Finally, the company estimates its current-year capital expenditure in the $545-$595 million range.
QEP Resources expects to generate positive free cash flow of $100 million for 2020 at an oil price of $50 a barrel.
Zacks Rank & Key Picks
QEP Resources has a Zacks Rank #3 (Hold). Some better-ranked players in the energy space are Contango Oil & Gas Company (NYSE:MCF) , Earthstone Energy, Inc. (NYSE:ESTE) and Chesapeake Energy Corporation (NYSE:CHK) , each carrying a Zacks Rank #2 (Buy). You can see the complete list of today’s Zacks #1 Rank (Strong Buy) stocks here.
Just Released: Zacks’ 7 Best Stocks for Today
Experts extracted 7 stocks from the list of 220 Zacks Rank #1 Strong Buys that has beaten the market more than 2X over with a stunning average gain of +24.7% per year.
These 7 were selected because of their superior potential for immediate breakout.
See these time-sensitive tickers now >>
Chesapeake Energy Corporation (CHK): Free Stock Analysis Report
QEP Resources, Inc. (QEP): Free Stock Analysis Report
Contango Oil & Gas Company (MCF): Free Stock Analysis Report
Earthstone Energy, Inc. (ESTE): Free Stock Analysis Report
Original post
Zacks Investment Research