The second quarter of 2018 saw a continuation of themes apparent in the first quarter. In June the Federal Reserve continued raising rates to a federal funds rate target that now stands at 1.75%–2.00%. The flattening of the yield curve can be seen in the graph and table below. The 2-year, 10-year and 30-year US Treasury bond rates continued to increase but at a pace that was measurably slower than in the first quarter.
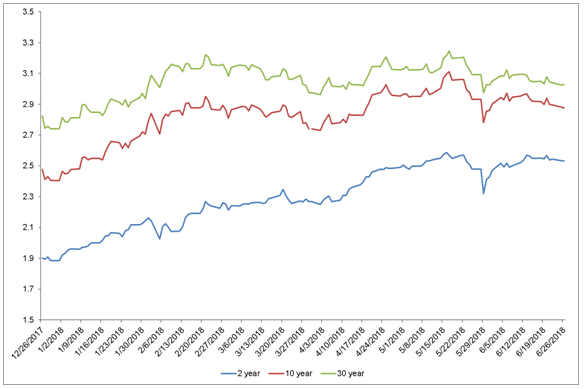

*Data as of 6/26/18 Source: Bloomberg
The 2-year note rose the most in the second quarter, followed by the 10-year, with minimal movement in the 30-year Treasury. Thus the Treasury yield curve continues to flatten. Conventional wisdom holds that yield curves become flat in front of a recession, and those who embrace this notion now worry whether yield curve flattening may in fact signal an imminent recession. For now we disagree with that prognosis, for the following reasons:
- The yield curve is flattening, but it is not totally flat yet. In contrast, by the time the Federal Reserve was done hiking in the last cycle of 2004 to 2006, the yield curve looked like this.
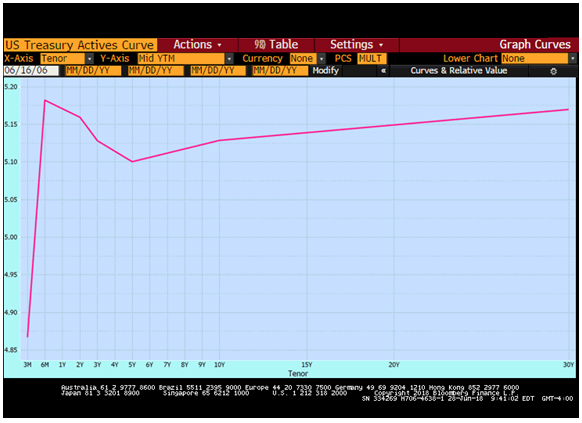
Source: Bloomberg
At that point in time the fed funds rate was slightly higher than the 30-year bond. Contrast that to the situation today, where there is still a 100-basis-point difference between the two.
- Long Treasury yields are seeing plenty of demand because they are cheap relative to the rest of the world.
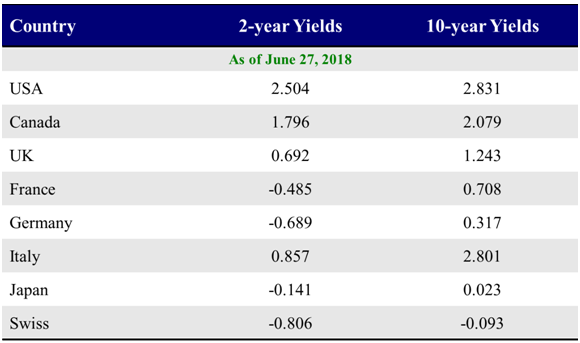
Here’s a recent comparison of US 2-year and 10-year bond yields to those of other G-7 countries.
Source: Bloomberg
The US yield advantage ranges from 70 basis points to 330 basis points in the 2-year note and (if you exclude Italy at 3 basis points) from 80 to 292 basis points on the 10-year note. It’s hard to argue with the large advantage that US bond yields offer compared to bond yields in the financially healthy G7 countries and particularly the less healthy ones. As long as the European Central Bank and the Bank of Japan are still in easing mode, the US government bond market should look good to global investors seeking sovereign debt. Call it an over- demand for longer Treasuries if you will, but global investors have viewed the US market as a bargain and kept downward pressure on yields.
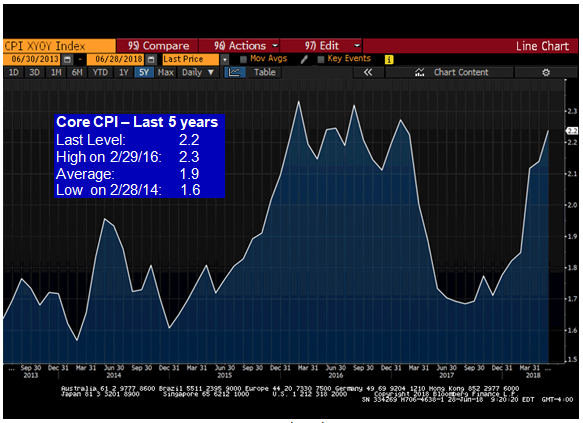
- Inflation has remained low relative to unemployment and relative to where the Fed thought inflation might be.
Source: Bloomberg
Inflation has remained low – even with the low unemployment rate. Core inflation is lower now than late in 2015 and in 2016. Phillips curve enthusiasts have been frustrated, since the traditional tradeoff is that higher inflation accompanies lower unemployment. Certainly, inflation has stayed low for a number of reasons, including a stronger dollar, as well as the “Amazon (NASDAQ:AMZN) effect,” which posits that it is very hard for manufacturers in any and all sectors to move prices meaningfully higher without drastic competition.
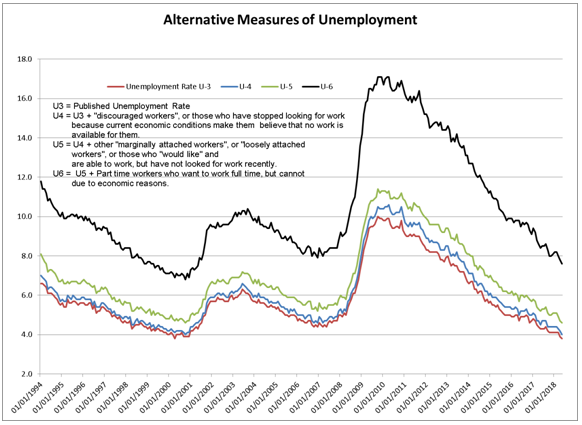
But another factor is also at work, and that is the real unemployment rate (U-6), which encompasses workers beyond the standard (U-3) measurement of unemployment. This measure includes people who are not working but not currently looking for work, people who have jobs but are looking for better jobs (think of someone downsized in the recession who now has a job but not at the level they had pre-recession), and people who are working part-time – some because they wish to work part-time and others because they can’t obtain full-time work.
Source: St. Louis Fed
In this graph we see the difference between the narrow measure of unemployment, U3 and the broader measure, U6. The gap – huge at the peak of the recession – has narrowed, but it is still larger than the gap that existed pre-recession. This gap is why the Federal Reserve has undertaken a more patient, slower pace of rate hikes than previous Feds: We think today’s Fed members are sensitive to the broader measures of unemployment, which until recently have been stubbornly high. And the gap is also one of the reasons that inflation has been slow to rise – particularly in the area of wages. The economy needs to lower this gap before wage inflation starts to work its way into higher inflation rates in the general economy.
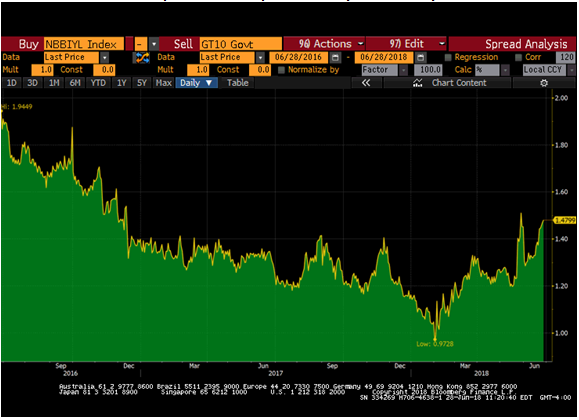
Finally we have started to see some higher yield spreads on corporate bonds.
Corporate Bond Spread Vs. 10-year Treasury
Source: Bloomberg
We think some of this is reversion to the mean after two years of narrowing corporate bond yield spreads. But the trend may reflect some of the same jitters caused in the equity markets by the tariff tantrums. We feel this way because the yield ratios on municipal bonds have been narrowing. Part of that narrowing is supply-driven, but the difference between the two is another piece of evidence that the muni credit has dominant powers in many cases (think water, sewer, and transportation) and is not subject to the same profit jitters that affect corporations.
We wish all our readers a happy and healthy Independence Day.
