Grocery store operator Weis Markets Inc (NYSE:WMK) shares have been chopping in range for the past few months, but still trading above its pre-pandemic February 2020 highs and outperforming the benchmark S&P 500 index
The Mid-Atlantic operator of 197 stores has been executing a consistent operating strategy that has paid off during the pandemic. The Company recently declared a $0.31 per share quarterly dividend.
Surprisingly there isn’t much coverage on this grocery chain, which explains the thinner trading volumes. A closer comparison of its financial metrics against both large and smaller peers against the pandemic backdrop indicates a good value proposition at the right prices. Long-term investors seeking solid consistent growth at a value can consider monitoring shares for opportunistic pullback entries to gain exposure.
Q2 FY 2020 Earnings Release
Weis Markets reported its second-quarter earnings report on Aug. 3, 2020, for the quarter ending in June 2020. The Company reported an earnings-per-share (EPS) profit of $1.54 to $41.5 million excluding non-recurring items, up 102.5% year-over-year (YoY) from $20.5 million for the same quarter in 2019. Revenues surged 23.7% YoY to $1.1 billion. Comparable same-store sales grew 24.1% YoY. Ecommerce sales grew 243% YoY. While the pandemic initially triggered full and partial shutdown, re-openings starting in June 2020.
Peer Comparisons
Weis Markets shares have a year-to-date (YTD) price performance of around 17.5% not including the 2.61% dividend. The Company has been a consistent performer with a trailing twelve month (TTM) GAAP price-to-earnings (P/E) performance of 12.63 and trading at 0.33 price-to-sales (P/S). It boasts a healthy gross profit margin (GPM) of 28.7% besting the larger Kroger (NYSE:KR) GPM of 23.62%. Weis Markets also best Kroger with a 32.92% EBITDA YoY growth versus 22.43% for Kroger. Granted, Weis Markets is a much smaller competitor with just 197 locations versus over 2,760 locations for Kroger, it operates more efficiently with an EBIT margin of 3.45% versus 2.71% for Kroger.
Debt Metrics
During the pandemic, essential businesses like most grocers were allowed to operate under certain restrictions and safety controls. Grocery stores have notoriously thin margins. Grocers also lever heavy debt loadsto expand that margin. The debt picture is where Weis Markets outshines its competitors large and small. The Company has $206 million in cash versus $211 million in debt and no long-term debt.
The total debt-to-equity is just 19 compared to 211 for Kroger, 226 for Sprouts Farmers Market (NASDAQ:SFM), 121 for SpartanNash (NASDAQ:SPTN) and 114 for Ingles Markets (NASDAQ:IMKTA). The Company is an efficiently operated self sufficient operations demonstrating consistency throughout the years. Ironically, for a Company that’s been publicly traded for decades, one would expect more analyst coverage. It is worth nothing that appealing operating efficiencies and no long-term debt make Weis Markets a viable acquisition target but larger peers or companies looking to make or grow their footprint in the Mid-Atlantic region.
Managing Share Liquidity
The lack of analyst coverage has kept these shares under the radar. With average daily trading volumes tracking under 100,000 shares, it pays to be patient and wait for bargain entries. Shares of supermarket stocks have been pulling back in recent weeks as they contract from the initial pandemic stockpiling phenomenon stemming from isolation mandates. This can present opportunistic pullback levels for patient shoppers. To offset the thinner liquidity, it’s prudent to scale into a position with vary limit orders that span the lower range in a pyramid fashion to generate the best average position price.

WMK Opportunistic Pullback Levels
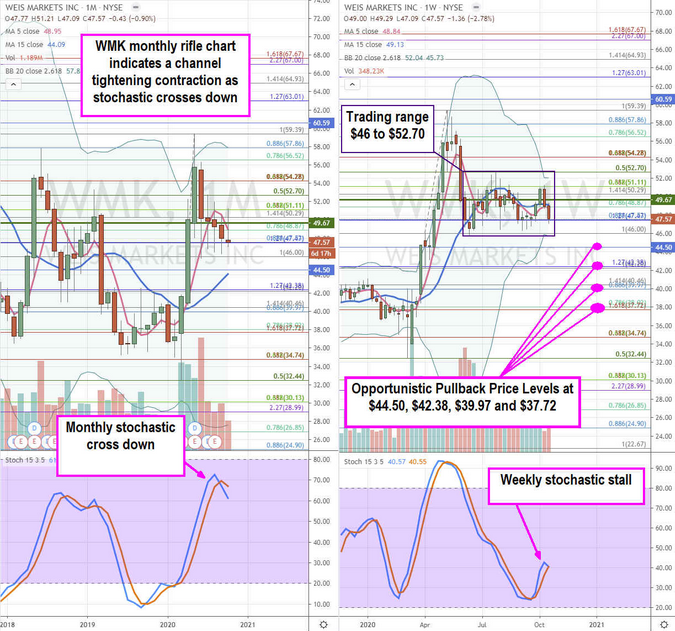
Using the rifle charts on the monthly and weekly time frames provides a broader view of WMK stock. As noted earlier, grocery store stocks have been contracting off their peaks. WMK is no exception as shares have fallen from its $59.39 highs. The monthly rifle chart shows the peak and stochastic cross down indicating a channel tightening downdraft is coming with a falling 5-period moving average (MA) at the $48.87 Fibonacci (fib) level.
The weekly rifle chart formed a market structure low (MSL) buy trigger at $49.68, but due to the thinner liquidity, investors should avoid chasing and opt for opportunistic pullback levels at the $44.50 fib, $42.38 fib, $39.97 fib and the $37.72 fib.
Investors should keep abreast of the industry sentiment by tracking the peer stocks including KR, SFM, SPTN and IMKTA. These stocks tend to move as a group and when one Company experiences a large price gap up or down, the ripple effects can impact its pe
