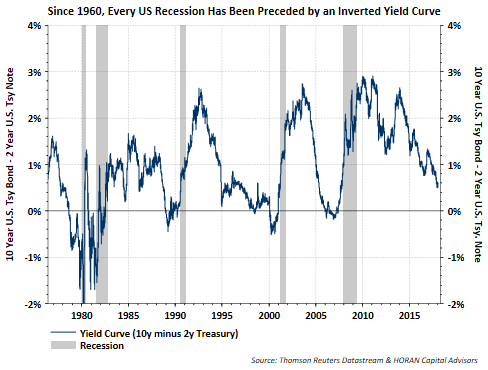
During the Fed's move to increase short term interest rates, some have expressed concerns due to the yield curve's increased flattening, i.e., short rates moving higher versus long term interest rates. This increased flattening move can be seen in the below chart and the concern centers around the fact that every recession since 1960 has been preceded by an inverted yield curve, i.e., short term rates higher than long term rates. The move by the Fed to push short term rates higher is part of a normal process to get interest rates back to a normalized level. 
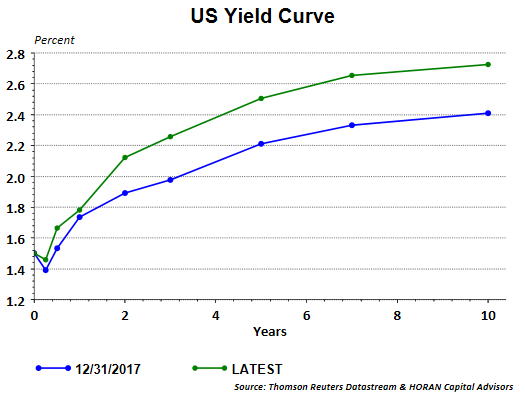
Although only one short month has passed, concerns about an inverted curve and recession may be subsiding. As the below chart clearly shows, the yield curve has been steepening over the last 30 days as indicated by a move higher in the 10-year Treasury yield while short rates (U.S. 2-year) are nearly unchanged. 
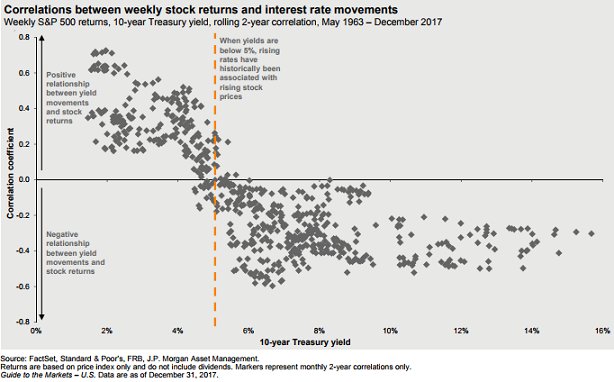
In the past, when the 10-year Treasury yield moves higher from below a 5% yield, stocks and rates have had a positive correlation, i.e., stocks rise as rates rise. 
As noted in a Reuters article yesterday, “Key [interest rate] levels were taken out, the trend is broken,” said Tom di Galoma, a managing director at Seaport Global Holdings in New York. “It’s probably a realization that the global economy is moving ahead and has quite a bit of steam.” The bond market's realization that economic growth is picking up around the world should be a positive for stock returns. In other words, a recession does not seem like a probable outcome near term.
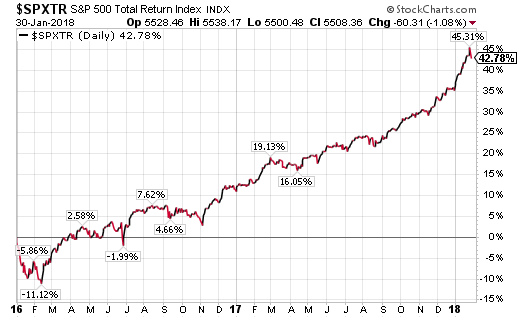
The below chart represents the S&P 500 Total Return Index over the last two years. The 2-year total return equals 42.78% and is down only 2.53 percentage points in two days. 
What has been a surprise with this market is the lack of any significant downside equity market volatility. As I have noted a number of times in recent blog posts, the average intra-year pullback going back to 1980 is over 14%. The last double digit decline was nearly two years ago, February 2016, and can be seen on the above chart. A further 12% decline, or 3,000 Dow points, from today's market level would take the market back to October of 2017 levels. It could happen and would be a normal market clearing in my view. If this were to occur, given the strong economic and corporate underpinnings, a recession is not likely and the decline would represent a healthy market function.
