
Prologis, Inc. (NYSE:PLD) reported fourth-quarter 2017 core funds from operations (FFO) per share of 67 cents, beating the Zacks Consensus Estimate of 66 cents. Results also compared favorably with the year-ago figure of 63 cents. The company experienced solid operating results and higher net promote income.
Net effective rent change improved in the quarter, while period-end occupancy remained at a record high.
The company generated rental and other revenues of $551.8 million, comfortably beating the Zacks Consensus Estimate of $534.3 million. Total revenues for the quarter amounted to $619.9 million and remained nearly unchanged year over year.
For full-year 2017, core FFO per share came in at $2.81, well ahead of the prior-year tally of $2.57. This was backed by 3.4% year-over-year growth in total revenues to $2.6 billion.
Quarter in Detail
At the end of the reported quarter, occupancy level in the company’s owned and managed portfolio was 97.2%, expanding 10 basis points (bps) year over year. The record occupancy level was driven by the U.S. portfolio which experienced 98.0% of occupancy.
During the quarter under review, Prologis signed 42 million square feet of leases in its owned and managed portfolio compared with 39 million square feet recorded in the year-ago period.
Prologis’ share of net effective rent change was 19.0% in the reported quarter compared with 16.0% recorded a year ago. The figure was led by the U.S. portfolio, which recorded impressive growth of 29.8%. Cash rent change was 8.8%, as against 7.0% recorded in the year-earlier quarter.
Net effective same-store net operating income (NOI) registered 4.1% growth compared with 3.2% increase reported in the comparable period last year. This was led by 5.4% growth reported in the U.S. portfolio. Cash same-store NOI rose 5.5% compared with 4.4% reported in the year-ago period, reflecting 6.8% growth in the U.S. portfolio.
In fourth-quarter 2017, Prologis’ share of building acquisitions amounted to $79 million, development stabilization aggregated $525 million, while development starts totaled $692 million. Furthermore, the company’s total dispositions and contributions came in at $839 million.
Liquidity
Finally, the company exited the fourth quarter with cash and cash equivalents of $447.0 million compared with $568.7 million recorded at the end of the prior quarter.
Moreover, Prologis and its co-investment ventures accomplished $1.9 billion of refinancing as well as redeemed $788 million of near-term bonds during the quarter. In addition, for the full year, the company reported a 340-basis-point contraction in leverage to 23.7% on a market capitalization basis.
Outlook
Prologis offered its core FFO per share outlook for full-year 2018. The company projects core FFO per share in the range of $2.85-$2.95. The Zacks Consensus Estimate for the same is currently pegged at $2.88.
Our Take
The industrial real estate market is enjoying elevated demand for logistics infrastructure amid an e-commerce boom, recovering economy and job market, as well as healthy manufacturing environment. Amid this, Prologis is well poised to benefit from its capacity to offer modern distribution facilities at strategic in-fill locations.
However, a whole lot of new buildings are slated to be completed and made available in the market in the near term. Also, intensifying competition from other market participants and rate hike remain concerns.
Prologis currently carries a Zacks Rank #4 (Sell). You can see the complete list of today’s Zacks #1 Rank (Strong Buy) stocks here.
Prologis, Inc. Price, Consensus and EPS Surprise
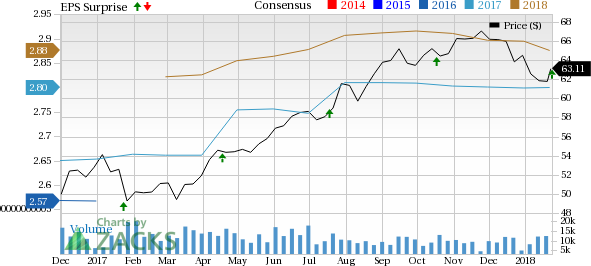
Prologis, Inc. Price, Consensus and EPS Surprise | Prologis, Inc. Quote
We now look forward to the earnings releases of other REITs like SL Green Realty Corp. (NYSE:SLG) , Alexandria Real Estate Equities, Inc. (NYSE:ARE) and Boston Properties, Inc. (NYSE:BXP) . SL Green is slated to report fourth-quarter earnings on Jan 24, while Alexandria and Boston Properties have earnings releases scheduled for Jan 29 and Jan 30, respectively.
Note: All EPS numbers presented in this write up represent funds from operations (“FFO”) per share. FFO, a widely used metric to gauge the performance of REITs, is obtained after adding depreciation and amortization and other non-cash expenses to net income.
Wall Street’s Next Amazon (NASDAQ:AMZN)
Zacks EVP Kevin Matras believes this familiar stock has only just begun its climb to become one of the greatest investments of all time. It’s a once-in-a-generation opportunity to invest in pure genius.
Click for details >>
Prologis, Inc. (PLD): Free Stock Analysis Report
Boston Properties, Inc. (BXP): Free Stock Analysis Report
SL Green Realty Corporation (SLG): Free Stock Analysis Report
Alexandria Real Estate Equities, Inc. (ARE): Free Stock Analysis Report
Original post
Zacks Investment Research