
The case for holding a portfolio that’s diversified across markets and asset classes is built on the assumption that return correlations will remain below 1.0 (perfect positive correlation) by more than a trivial degree. To the extent that you own assets that move independently of one another you’ll reap the rewards of diversification, which is widely celebrated as the only true free lunch in investing. Fortunately, correlations for the major asset classes are usually below 1.0. But the numbers vary and persistently low and negative correlations are rare.
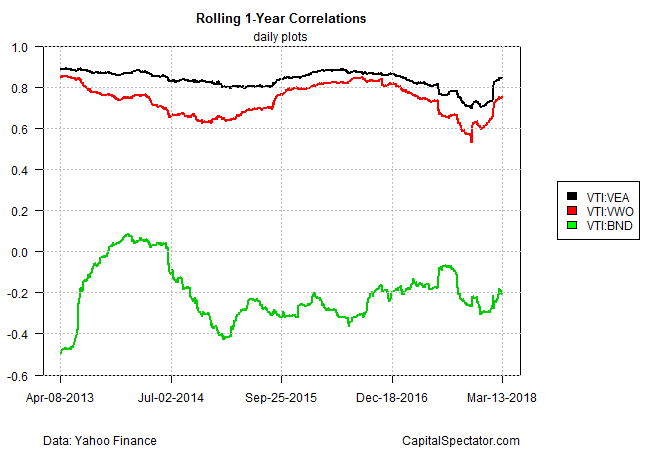
What should you expect when perusing pairwise correlations for the design and management of portfolios? The answer varies, sometimes by quite a lot, depending on the assets you’re targeting, the trailing window you’re focusing on, and the parameters you choose for analyzing correlations. For some perspective, consider how three sets of pairwise correlations stack up on a rolling one-year basis (using daily returns) for three ETFs representing US stocks (Vanguard Total Stock Market (NYSE:VTI))/US bonds (Vanguard Total Bond Market (NYSE:BND)), US stocks (Vanguard Total Stock Market (NYSE:VTI))/Vanguard FTSE Developed Markets (NYSE:VEA), and US stocks (Vanguard Total Stock Market (NYSE:VTI))/emerging markets stocks (Vanguard FTSE Emerging Markets (NYSE:VWO)).
As the chart below shows, correlations aren’t stable. The recent spike in market volatility, for instance, has lifted correlations for most pairings. One thing that hasn’t changed is the fact that correlations remain moderately negative for stocks and bonds. The rolling correlation for VTI and BND over the past year, for instance, is roughly -0.2, as shown in the green line in chart. By comparison, the correlations for US and foreign stocks are highly positive, roughly 0.8 in recent history. There are diversification benefits for holding a global set of equities, but with correlations approaching 1.0 these assets exhibit a relatively high degree of similarity in terms of performance.
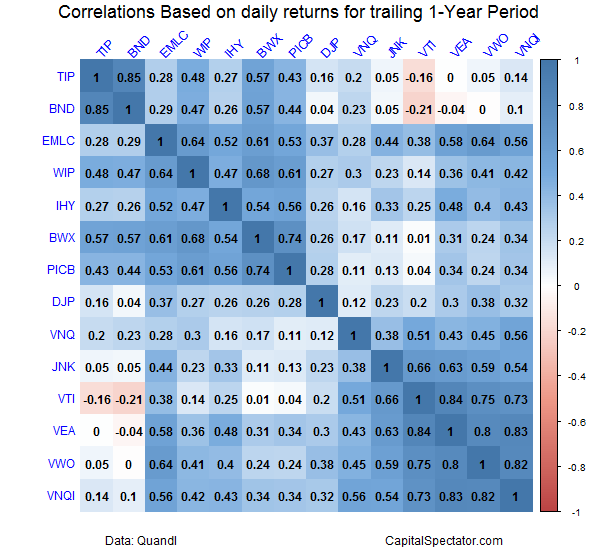
The good news is that expanding the opportunity set creates a much richer set of possibilities for building a robust multi-asset-class portfolio. Consider how all the pairwise correlations compare for the trailing one-year period for ETF proxies for the major asset classes (for a list of funds and their tickers see this post). As the table below reveals, there’s a relatively wide range of correlations for the various fund pairs. But it’s also clear that there are only a handful of pairs with negative correlations, indicated by the pink boxes. In fact, only US stocks (VTI) and US bonds (Vanguard Total Bond Market (NYSE:BND)) exhibit correlations below zero. There are, however, quite a few pairs with extremely low correlations: inflation-indexed Treasuries (iShares TIPS Bond (NYSE:TIP)) and foreign real estate (Vanguard Global ex-US Real Estate (NASDAQ:VNQI)), for example.
Keep in mind that the correlation structure will change based on the choice of trailing window. Which window should you choose? That depends on your time horizon. If you’re managing a long-term strategy, it’s reasonable to focus on a comparatively longer window. For more tactical portfolios, shorter windows make sense.
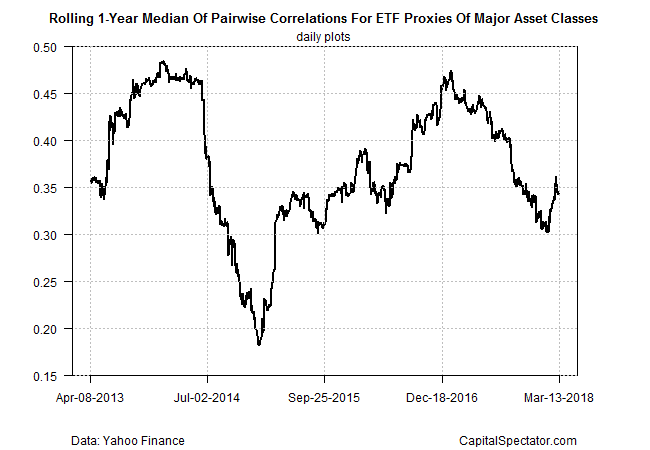
Fortunately, the correlations overall are far enough below 1.0 so that building a multi-asset-class portfolio will be a productive strategy. Consider, for instance, how the median correlation has evolved on a rolling one-year basis in recent history for all the asset classing pairings noted above. The next chart below reminds that a global portfolio via all the major asset classes reflects a median correlation of around 0.35, which is to say far below 1.0.
The caveat is that while correlations may post low or even negative readings most of the time, the pairings tend to move toward 1.0 in times of extreme events, such as the global financial crisis in 2008. That doesn’t invalidate multi-asset-class strategies, but it’s a reminder that looking at correlations in the rear-view mirror is only a starting point for designing and managing portfolios, particularly if the goal is building strategies that can withstand extreme bouts of market volatility.