
On May 15, 2017, we issued an updated research report on The Procter & Gamble Company (NYSE:PG) , a branded consumer products company with presence in more than 180 countries.
Procter & Gamble’s shares gained around 7.1% in the last one year, outperforming the 4.9% growth of the Zacks Consumer Staples sector. However, the company’s shares have underperformed the Zacks categorized Soap & Cleaning Preparations industry’s gain of 11.1% year to date.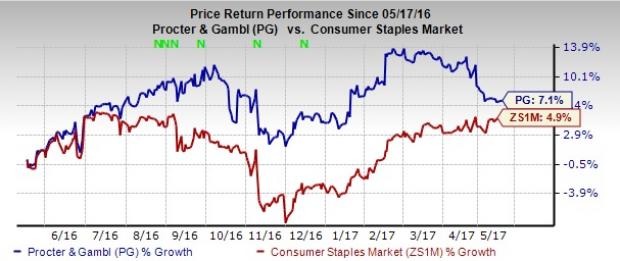
Third Quarter of Fiscal 2017 Highlights
The company recently released its fiscal third-quarter results, wherein earnings beat expectations by 2.1%, while revenues missed the same by 0.7%. Adjusted earnings grew 12% year over year but net sales growth was disappointing (down 1%), primarily due to the weakness in Grooming segment (down 6%).
Organic sales growth was at 1%, down from 2% in the last quarter and 3% in the fiscal first quarter, reflecting weak market growth. The company’s results were affected by market slowdown, continued geopolitical disruptions and foreign exchange challenges.
The company has been struggling to boost sales significantly for the last few quarters. Major foreign exchange headwind, weak volumes, divestitures and slowing market growth have been hurting sales. Lately, brand divestures and deliberate choices to exit some structurally unprofitable business lines also affected sales. The company’s net sales in the first nine months of fiscal 2017 decreased 0.4% year over year.
In fact, categories in the company’s largest and profitable market, the U.S. (accounting 40% of net sales), grew by less than a point in the fiscal third quarter, a lot lower than the approximate 2% growth in the first half of fiscal 2017. Overall, the company’s organic sales growth in developed markets was flat.
Although there has been moderate improvement in economic growth in the U.S., consumers are increasing their spending modestly, as a surge in job growth is yet to translate into significantly higher wages. High healthcare costs and still-tightened credit availability continue to hurt consumer discretionary spending in the U.S.
Again, foreign exchange is a major headwind for Procter & Gamble with almost 60% of the company’s business generated outside North America. Although Fx moderated in the first nine months of fiscal 2017, it still had an adverse impact of 2% on the top line and 3.5% on earnings per share.
Productivity Improvements and Cost-Saving Efforts Bode Well
In order to counter tepid sales growth trajectory and sustain its brand appeal, the company focuses on innovation and expansion of its product portfolio, supported by strong marketing and commercialization.
Again, we appreciate Procter & Gamble’s five-year (fiscal 2017-2021) productivity and cost-savings plan to reduce spending across all areas (supply chain, research & development, marketing and overheads). As a part of this program, the company intends to bring total potential savings of up to $10 billion over the period. Its productivity improvements and aggressive cost-saving efforts are also consistently helping in boosting profit level.
During the fiscal third quarter, management emphasized the importance of a new internal platform called “Irresistible Superiority”, which aims at increasing accountability and raise standards of excellence. The program has a strategic focus on product and packaging, superior execution of communications, in-store fundamentals and consumer value.
The company’s investments in promising innovation and go-to-market capabilities allow it to expand in more categories, geographies and channels, thus bolstering top and bottom-line growth.
Zacks Rank & Key Picks
Procter & Gamble currently holds a Zacks Rank #3 (Hold). You can see the complete list of today’s Zacks #1 Rank (Strong Buy) stocks here.
Better-ranked stocks in this industry include Church & Dwight Co., Inc. (NYSE:CHD) , Unilever PLC (NYSE:UL) and Unilever N.V. (NYSE:UN) , each carrying a Zacks Rank #2 (Buy).
For full-year 2017, Church & Dwight’s EPS is expected to grow 8.9%.
Unilever PLC is expected to register 17.3% EPS growth this year.
Unilever N.V.’s current-year EPS is expected to improve 14.7%.
5 Trades Could Profit ""Big-League"" from Trump Policies
If the stocks above spark your interest, wait until you look into companies primed to make substantial gains from Washington's changing course.
Today Zacks reveals 5 tickers that could benefit from new trends like streamlined drug approvals, tariffs, lower taxes, higher interest rates, and spending surges in defense and infrastructure. See these buy recommendations now >>
Unilever PLC (UL): Free Stock Analysis Report
Unilever NV (UN): Free Stock Analysis Report
Procter & Gamble Company (The) (PG): Free Stock Analysis Report
Church & Dwight Company, Inc. (CHD): Free Stock Analysis Report
Original post
Zacks Investment Research