Get 40% Off
👀 👁 🧿 All eyes on Biogen, up +4,56% after posting earnings. Our AI picked it in March 2024.
Which stocks will surge next?
Unlock AI-picked Stocks

Price-Momentum Implied Forecasts: REITs/Real Estate

Published 12/30/2016, 07:33 AM

This week’s year-end momentum profile of the major asset classes concludes today with a review of REITs/real estate, which follows updates on stocks, bonds, and commodities. The analytical lens is a two-part focus: 50- and 200-day moving averages, augmented with trailing one-year return (252 trading days). The goal: develop intuition about the near-term outlook for various slices of the global markets, based on a set of proxy ETFs. Since the agenda is analyzing price trends (as of Dec. 29), we’ll strip out distributions and look at price-only data, using charting resources via StockCharts.com.

Let’s begin with a broad measure of the market for US real estate investment trusts (REITs). The trend is a bit wobbly at the moment for Vanguard REIT (NYSE:VNQ). Although the fund is holding on to a slight one-year gain in price-only terms, the recent dip of the 50-day moving average below its 200-day counterpart raises a warning flag.
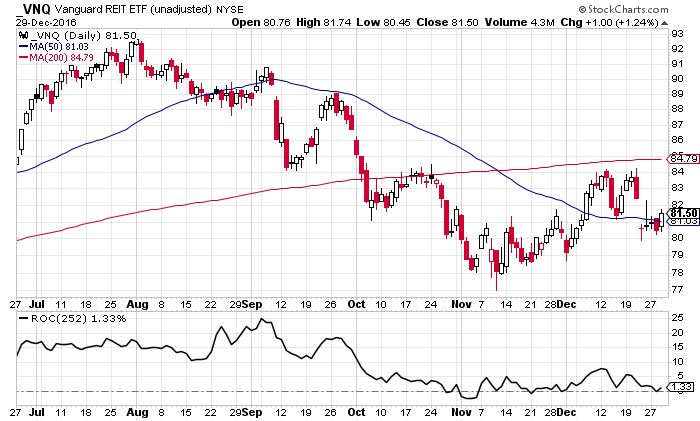
Vanguard REIT

A cautious reading also applies to the residential slice of US REITs (iShares Residential Real Estate Capped (NYSE:REZ).
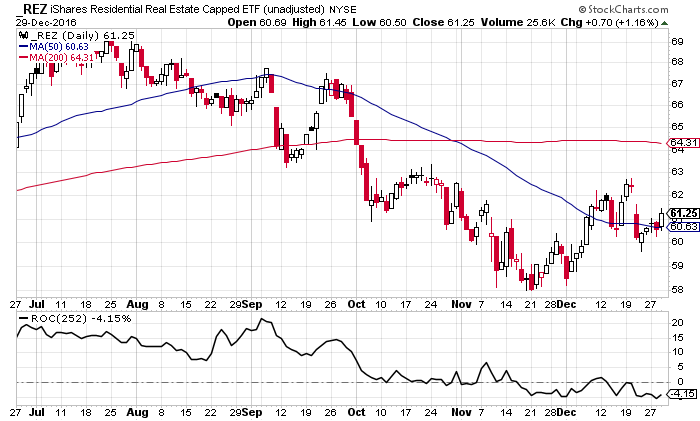
iShares Residential Real Estate Capped

By contrast, a bullish trend prevails for another sub-category of US securitized real estate—mortgage REITs. VanEck Vectors Mortgage REIT Income ETF (NYSE:MORT) is currently posting a solid 13% price-only one-year return and the fund’s 50-day average is comfortably above the 200-day average.
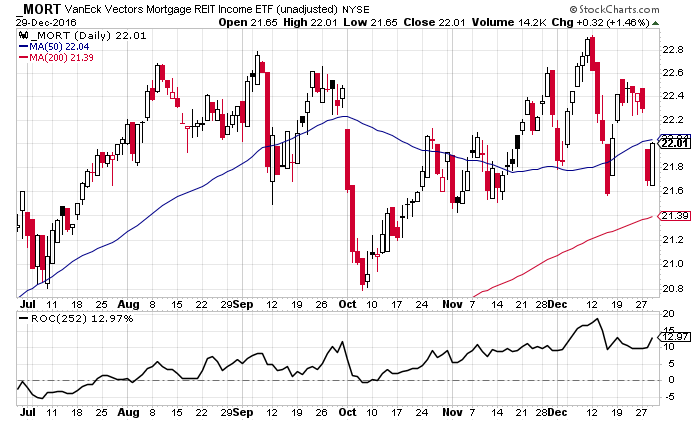
VanEck Vectors Mortgage REIT Income

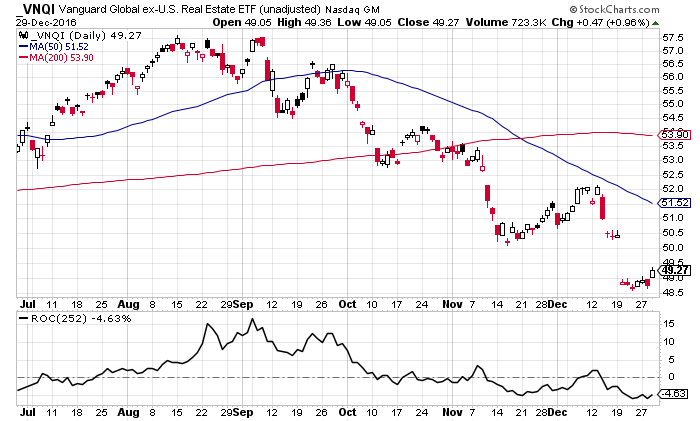
Moving on to foreign markets, a bearish trend is conspicuous in recent history for Vanguard Global ex-US Real Estate ETF (NASDAQ:VNQI). The ETF has been sliding in recent months and the technical profile implies that the fund is headed for a weak start in the new year.
3rd party Ad. Not an offer or recommendation by Investing.com. See disclosure here or remove ads .

Vanguard Global ex-US Real Estate

Selling also dominates trading for iShares Europe Developed Real Estate (NASDAQ:IFEU). The fund’s price only one-year change is firmly negative and the 50-day average has gapped well below the 200-day average.
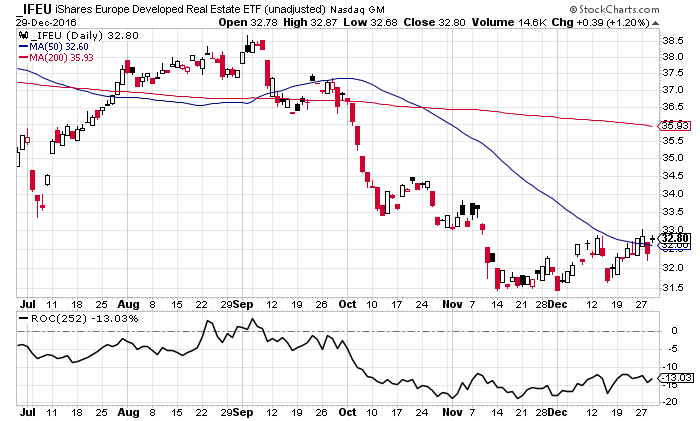
iShares Europe Developed Real Estate

Finally, negative momentum appears to be accelerating in China’s real estate sector, based on price-only data for Guggenheim China Real Estate ETF (NYSE:TAO). The one-year return is slightly negative and the downward-sloping 50-day average may soon fall below the 200-day average.
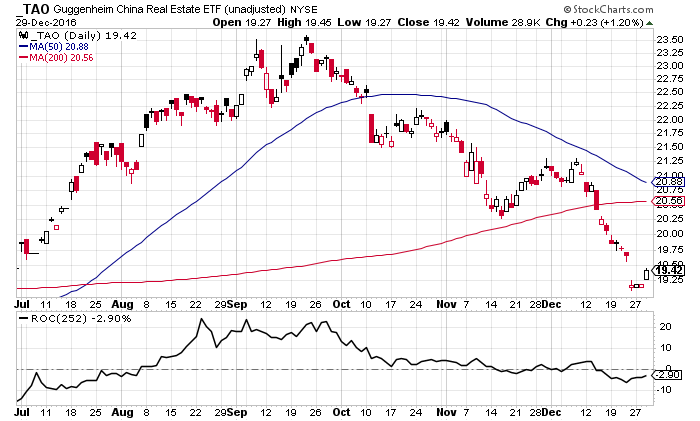
Guggenheim Invest China Real Estate

Latest comments

Risk Disclosure: Trading in financial instruments and/or cryptocurrencies involves high risks including the risk of losing some, or all, of your investment amount, and may not be suitable for all investors. Prices of cryptocurrencies are extremely volatile and may be affected by external factors such as financial, regulatory or political events. Trading on margin increases the financial risks.
Before deciding to trade in financial instrument or cryptocurrencies you should be fully informed of the risks and costs associated with trading the financial markets, carefully consider your investment objectives, level of experience, and risk appetite, and seek professional advice where needed.
Fusion Media would like to remind you that the data contained in this website is not necessarily real-time nor accurate. The data and prices on the website are not necessarily provided by any market or exchange, but may be provided by market makers, and so prices may not be accurate and may differ from the actual price at any given market, meaning prices are indicative and not appropriate for trading purposes. Fusion Media and any provider of the data contained in this website will not accept liability for any loss or damage as a result of your trading, or your reliance on the information contained within this website.
It is prohibited to use, store, reproduce, display, modify, transmit or distribute the data contained in this website without the explicit prior written permission of Fusion Media and/or the data provider. All intellectual property rights are reserved by the providers and/or the exchange providing the data contained in this website.
Fusion Media may be compensated by the advertisers that appear on the website, based on your interaction with the advertisements or advertisers.
© 2007-2024 - Fusion Media Limited. All Rights Reserved.