Will the EUR/NZD rise? Such dynamics are observed in case of the strengthening of the euro and the weakening of the New Zealand dollar. Macroeconomic indicators of the eurozone demonstrate an upward tendency, which may encourage investors to buy the single European currency. The main risk for the euro is the next ECB meeting during which, the plans of the launch of money emission for the TLTRO asset purchase program can be announced. It will take place on March 7. No changes in ECB rates are expected. A negative factor for the New Zealand dollar may be the desire of the Reserve Bank of New Zealand to tighten its capital requirements for local banks (Tier 1 Capital). In addition, an increase in the foreign trade deficit of New Zealand in January may contribute to its weakening. Let us note that a negative foreign trade balance has been observed since 2014.

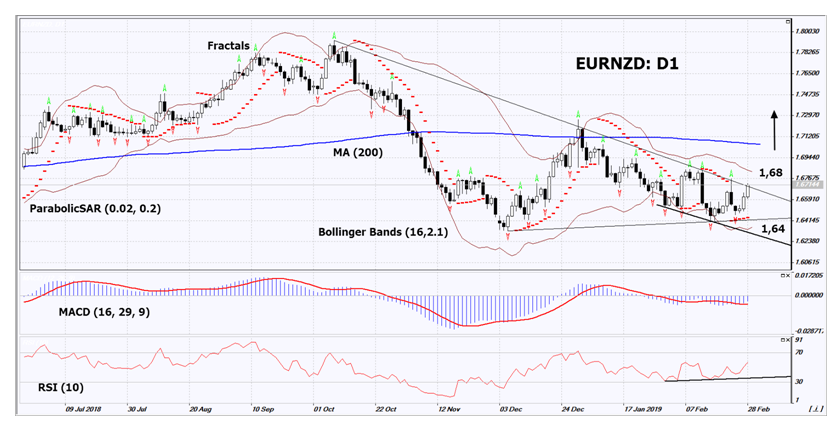
On the daily timeframe, EUR/NZD: D1 is trying to breach up the resistance line of the downtrend. Most technical analysis indicators formed buy signals. The further price increase is possible if the ECB postpones the easing of monetary policy.
- The Parabolic Indicator gives a bullish signal.
- The Bollinger bands® have widened, which indicates high volatility. The lower Bollinger band® is titled upward.
- The RSI indicator is above 50. It has formed a positive divergence.
- The MACD indicator gives a bullish signal.
The bullish momentum may develop in case EUR/NZD exceeds the upper Bollinger band®, its last fractal high and the resistance line of the downtrend at 1.68. This level may serve as an entry point. The initial stop loss may be placed below the two last fractal lows and the Parabolic signal at 1.64. After opening the pending order, we shall move the stop to the next fractal low following the Bollinger and Parabolic signals. Thus, we are changing the potential profit/loss to the breakeven point. More risk-averse traders may switch to the 4-hour chart after the trade and place there a stop loss moving it in the direction of the trade. If the price meets the stop level (1.64) without reaching the order (1.68), we recommend to close the position: the market sustains internal changes that were not taken into account.
Summary of technical analysis
Position Buy
Buy stop Above 1.68
Stop loss Below 1.64
Market Overview:
U.S. and DPRK did not sign an agreement on the denuclearization of the Korean Peninsula
U.S. stocks fell amid failed negotiations between U.S. and DPRK leaders on Thursday
Donald Trump and Kim Jong-un did not agree to conclude a deal for North Korea to abandon nuclear technology in exchange for economic assistance. Their negotiations ended even 2 hours earlier than planned. Investors decided that this increases global risks and US stock indices dropped. However, the S&P 500 is now 11% higher than the opening level of the year, which is a good indicator. Data on U.S. GDP for the 4th quarter were noticeably better than expected. Its growth was 2.6%. As a result, for the entire 2018 year, the American economy grew by 2.9%, which is the maximum since 2015. Due to these futures on U.S. stock indices are now trading with a marked increase and we can assume growth of quotations at the opening of stock exchanges in the United States. The ICE (NYSE:ICE) US Dollar Index is growing for the 3rd day in a row today. In addition to positive data on GDP, this is facilitated by the collapse of the Japanese yen against the background of US-DPRK unsuccessful negotiations. Today at 14:30 CET the data on personal income and expenses for December will be released in the USA. At 16:00 CET ISM business and consumer confidence indicators from the University of Michigan will be published as well.
EUR/USD continues being traded in a narrow range
Today at 11:00 CET data on inflation for February and unemployment for January will be published in the Eurozone. Yesterday inflation in Germany exceeded forecasts. If it significantly increases in the whole EU, then this may encourage the ECB to postpone the launch of TLTRO (Targeted Longer-Term Refinancing Operations). Yesterday against the backdrop of increasing global risks the Swiss Frank strengthened as shelter currency. Today CHF again weakened after reports of a decline in retail sales for January in Switzerland. The European-wide STOXX 600 stock index rose 3.9% in February after a 6.2% increase in January. Yesterday it slightly decreased, but market participants remain optimistic. The growth leader was the banking sector, which could benefit from the launch of the TLTRO program.
The Japanese Nikkei gained and again updated the 10-week maximum.
The yen collapsed after unsuccessful negotiations between the U.S. and North Korea. Against this background, the shares of exporting companies were in demand: TDK Corp (+ 4.3%), Advantest Corp (+ 4.1%) and Fanuc Corp (+ 1.9%). This morning data on unemployment, inflation in Tokyo and other indicators were released in Japan. Generally, they were neutral. Capital expenditures for the 4th quarter and PMI Manufacturing in February for industry increased. This had an additional positive impact on Nikkei. Australian and New Zealand dollar continued strengthening due to the publication of good statistics in China, which is the main trading partner of these countries. The growth of the indicator of business activity in the industry - Caixin / Markit Manufacturing Purchasing Managers' (PMI) for February turned out to be better than expected.
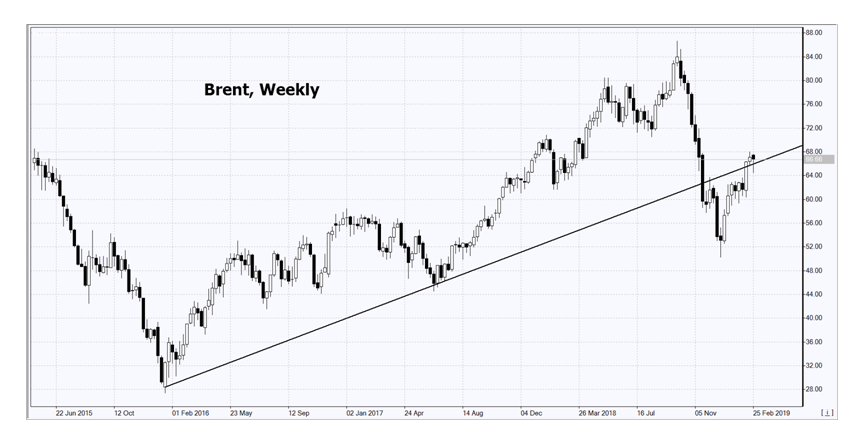
Quotations for Brent regained some of the losses
World oil prices rose due to the announcement by the Venezuelan oil company PDVSA to reduce exports by 40% after the introduction of U.S. sanctions on January 28. In February oil exports from Venezuela decreased to 920 thousand barrels per day (bwd) from 1.56 million bwd on average in previous months. In addition according to official U.S. Energy Information Administration, US oil production declined in December 2018, for the first time since May to 11.85 million bwd. This is 56 thousand bvd less than in November.

