Summary
The strategy discussed below may play a very significant role for a portfolio hedger who wishes to use relatively little capital for the purpose being achieved (assuming the inverse relationship between silver and equities), while offering speculators what may be the single greatest expression of very long term leverage that I have ever seen in my 32 years in the industry, including the other major silver troughs, as well as the Japanese, Shanghai and New York summits.
Two other simultaneously written reports illustrate the confluence of events in the other major asset classes that are supportive and consistent with the here-contemplated Wave-3 eruptions in the precious metals.
GOLD (GLD)
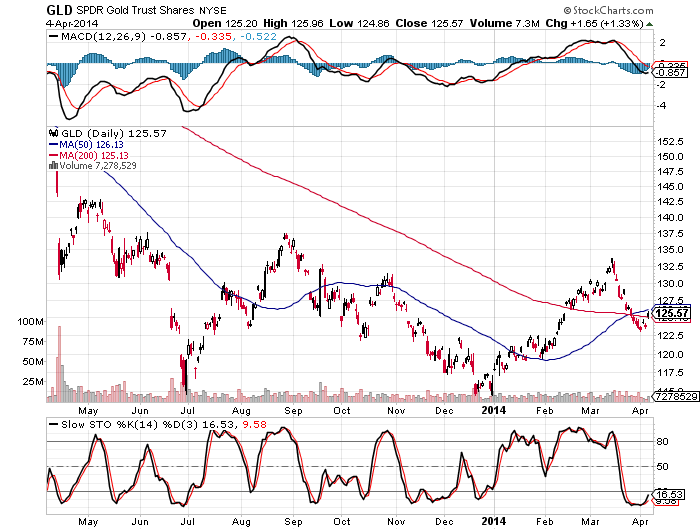
The 1-year (ARCA:GLD) chart that follows shows that the GLD MACD indicator is very oversold (above price chart), but, in itself, this is not a bullish indicator. Since there is no divergence, though none is mandatory, there is nothing bullishly confirmed in the fact that the slow stochastic is outrageously oversold either (below price chart).
However, taking everything together is worthwhile.
The GLD has achieved neckline support which is apparent at ~122. Meanwhile, gold has satisfied a 50% correction of the entire run-up from the low. This in noteworthy.
Noteworthy as well is the fact that this neckline support may also be the right shoulder to a reverse shoulder-head-shoulder formation, with the left shoulder and head having occurred at the end of June and December, respectively.
I would like to revisit discussion of a development that is expected later this year, which will rally the Dollar after the anticipated smash (see separate article), while being a sparkplug to further invigorate the PMs and soothe that laments of PMs bulls who bemoan fictitious and empty promises of meaningless tapering by the Fed.
In itself, euro printing is a further catalyst for the precious metals eruption, as everyone frets about the Fed's scaling back from an obscene level of monthly paper creation, which itself approaches the market value of all of the world's above-ground silver.
The US, Japan, Britain, Switzerland and China had taken the lead, so only the Europeans remain. When the Japanese went on their printing spree, it was evident at the Yen's peak that it was their turn in the sequence. This year, it is Europe's turn.

Now, we come to my favourite strategy for profiting from and/or hedging against the calamitous time ahead: long dated silver calls. But first, the (SLV).
At one point in time or another, I must have covered each of the positive long term fundamentals for silver. Now, I only look at the technical aspect, because the issue for me is not whether to buy, but when and how. However, the technicals are also why there has been nothing to celebrate for anyone who would simply have been straight long only (not spread).
Copper has been the noose around silver's neck of late, reigning it in when gold was providing precious impetus. Regarding the technical association, the good news is that, historically, copper has bottomed after silver, which, again, has reason to be pulled upward by gold.
The bad news is that copper's momentum indicators are now lined up in a manner that is consistent with another reversal of fortune.
This would be consistent with another short term bearish interpretation for silver. Namely, the all-powerful 6-month cycle next bottoms at the end of June and that could line up closer to when copper may more likely have troughed.

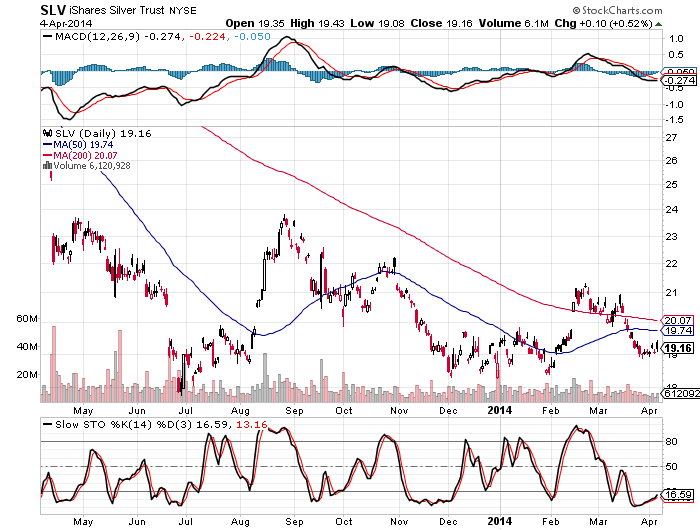
As we see from the 1-year SLV chart immediately above, like gold, a Wave-2 low may have now completed after having run up in a 5-wave fashion to conclude Wave-1 in February. This interpretation, of course, is wildly bullish.
There is no more bullish Elliott interpretation than this and is consistent with a turn up from deeply oversold levels for the slow stochastic. Again, however, there is no divergence, though none is required by rule. Divergences are higher probability bets, that's all.
But perhaps, above all else, please note this: sentiment is now more bearish than it was at the price low. This is consistent with the psychology of a wave-2 low of any degree, certainly a Wave-2 of long term nature.
To best have perspective of where we are today, it often behooves us to step back and take a bird's eye view, perhaps with a half-century perspective.
The last two years have produced many trend following PM mavens who never seem to get it wrong with multiple but-if scenarios, but long term track records require vision.
Coming back to our strategic point, silver's explosive position is now greater than it was, even in 2009; therefore, it merits an even more aggressive approach, albeit one that involves the use of less capital for an even greater bang for the buck.
Best indicator of poorer sentiment existing now than at the low? Premiums!
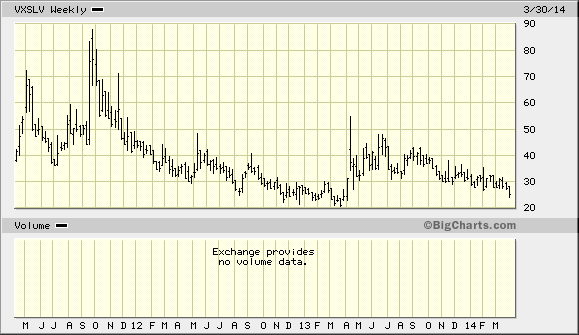
The VXSLV is a gage of SLV option premiums. The 3-year chart below illustrates significant technical considerations.
Firstly, the chart is at 1-year lows.
Secondly, we may note a 1-year descending wedge pattern. This suggests a violent Wave-3 eruption in the underlying security, the SLV.
Thirdly, we see a very long term reverse shoulder-head-shoulder formation.

CONCLUSION AND STRATEGY
Conclusion: Contemplating money flows, I wish to summarize the findings of 3 simultaneously written articles:
The Dow is terminal, as are the other major markets, including the Nikkei and Shanghai indices. The former is a negative Dow driver, given the squeeze on trend-exacerbating hedge funds, which went from under-owning the Nikkei to over-owning it.
Long bonds will soon complete its correction, thereby leading to lower long rates, which is, historically, very bullish for precious metals. For this reason, traders keep an eye on this indicator as well.
Also a major factor for PM traders is the historically inverse correlation to the Dollar. The Dollar can be smashed at any time (please see related article), which would be consistent with and coincidental to a Wave-3 advance in the metals.
Therefore, I summarize the above here since, if one-trillioneth of all of the money coming out of other assets moves into the super-shorted silver market, the metal could achieve much higher levels very fast, with exponentially mushrooming premiums.
In fact, the undervaluation of silver premiums have caused some to report of potentially damaging consequences to the financial system should silver blast off.
While anything is possible, throw in the aspect of sentiment, and all systems are go, insofar as a picture that is consistent with a pitch over the plate for the precious metals and my preferred approach for profiting from it.
Old-timers have been down this road, but never has the market lined up anything this good, to me anyway. And that's saying something.
Strategy: For the reasons above, and given the implications regarding sentiment and how I have determined that aspect (based on option premiums), 21-month call options provide the opportunity for 2000% returns and higher, withouteven trading along the way.
Proper management of the position at key SLV levels, and strategic adjustments at meaningful VXSLV points can compound returns to much higher levels, thereby offering investors a strategic hedging role for portfolios (again, assuming the inverse relation to equities).
For speculators, it is a once-in-a-lifetime opportunity.
