
Our trading team witnessed a big drop in platinum and palladium prices early this morning, while gold and silver continued to push moderately higher. We began to question this move and investigate any historical relevance to previous patterns. Our research team pointed out that both platinum and palladium rolled lower just three to four days before the breakdown in the U.S. stock markets on Feb. 24, while gold and silver were reaching recent price peaks. Could the patterns in precious metals be a warning of another potential volatility spike and price decline in the near future?
Are Metals Patterns Predicting A Big Downside Price Event?
Our research team created the charts below to help highlight the pattern that we are seeing in precious metals right now. First, we highlighted Feb. 24 with a light blue vertical line to more clearly illustrate where the markets initiated the COVID-19 breakdown event. Next, we drew shaded rectangles around new downside price rotation levels that took place near this peak in the U.S. stock markets. Lastly, we drew a red line that highlights the subsequent price
decline that took place in precious metals as the markets tanked in late February and early March 2020.
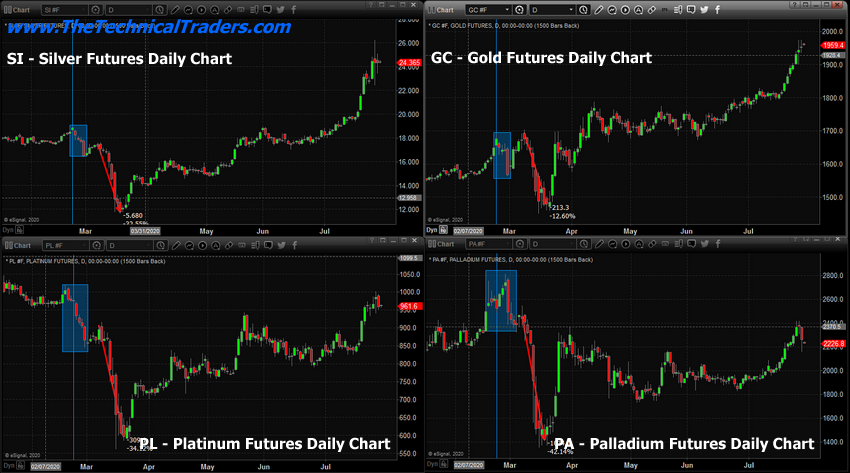
The current downside price move in platinum and palladium are very interesting because it appears platinum and palladium both initiated a downside/contraction price event just three to four days before gold and silver, as well as the rest of the U.S. stock market, began to collapse on Feb. 25. You can clearly see in the bottom two charts that platinum and palladium initiated a downside price correction a few days before both gold and silver reached their peak levels and began to move lower. Once this peak rotation took place, all four of the major metals groups moved moderately lower for about seven days before pausing, then collapsed even further.
Our researchers believe the current setup in platinum and palladium may be mirroring the February 2020 peak rotation and warning that a massive volatility event and downside price contraction event may be setting up and just days away from initiating.
The breakdown in precious metals at a time when the U.S. stock market is crashing is usually a result of margin calls – where traders experience losses in their trading accounts and much liquidate precious metals positions to cover these losses. This time, the downside event in precious metals may not be as deep or exaggerated as the February/March collapse. Skilled traders have already positioned their accounts to avoid margin calls. Only the novice traders
may be in a position to experience this type of event in the near future.
How Deep Will It Go?
Our researchers believe any future downside event in precious metals will likely stall near the recent support levels on these charts and immediately rotate back into a bullish trend because fear and greed won't allow metals to fall too far before greedy traders try to scoop up these positions at discounted price levels. Our support levels for the four precious metals shown are:
Silver: $19 to $21
Gold: $1,780 to $1,820
Platinum: $750 to $850
Palladium: $1,915 to $2,090
We believe any attempt to reach these levels in any of these four various precious metals would present a very strong buying opportunity for skilled technical traders. If it were to happen while a U.S. stock market volatility event was taking place and/or the U.S. stock market began a new downside price decline, then skilled traders should understand we may be seeing a similar type of price rotation event to the one that took place in February/March 2020 – representing a fantastic trading opportunity for those lucky enough to take advantage of the discounted price levels.
This next chart highlights what we believe may be the downside price event as it potentially takes place over the next 10 to 20+ days. Pay special attention to the differences in how silver, gold, platinum and palladium react to the fear event and where real opportunity exists near the end of this potential event. Platinum and palladium will likely fall 15% to 25% where gold may fall only 8% and silver may fall 15% to 20% before bottoming.
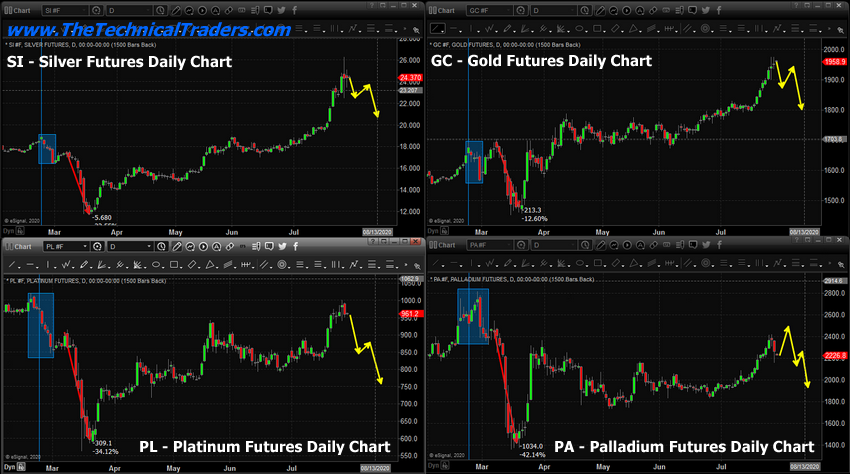
As technical traders, we can't pass up an opportunity like this when precious metals gift us with a potential 15% to 45%+ rotation in price that should be moderately easy to trade given our expectations. If this event takes place as we have described, skilled technical traders could begin to acquire smaller positions near our target levels, then wait to acquire bigger positions as the bottom sets up. Take a look at how gold and silver rallied after the February/March collapse. Gold rallied back to new highs within 45 days, whereas silver rallied higher over 4+ months, then broke higher just recently on a huge upside breakout move. platinum and palladium rotated more diligently throughout a 90-day span – never really reaching new highs after the peak in February 2020.
The reality of patterns like this is they are fun and exciting to find at this early stage of the setup. We're not 100% confident this pattern will play out as we expect yet – but we believe the probability is high that a volatility event is about to take place and that precious metals could react very similarly to the February/March 2020 price reactions again.
Quick Video Clip On Silver And Gold Predictions
{{youtube|{"id":"n7vCQ0XjrlE"}}}
As technical traders, we love this type of “telegraphed event” – even if it does not take place exactly as the previous event took place. It means we have an opportunity to take advantage of increased volatility and price rotation in one of our favorite sectors – metals. Get ready for this move. If we are correct, it may be your last chance to buy gold and silver at deep discounts for quite a while.