
With inflation surging and Fed Chair Jerome Powell praying for a “transitory” miracle, the troubles confronting the Fed are accelerating, not decelerating.
“I got the blues, Got those inflation blues”
– B.B. King
To explain, I wrote on Sep. 24:
I’ve warned on several occasions that the only way for the Fed to control inflation is to increase the value of the U.S. dollar and decrease the value of commodities. However, with commodities’ fervor accelerating on Sept. 23 – a day when the USD Index declined – the price action should concern Chairman Jerome Powell. As a result, FOMC participants’ 2022 inflation forecast is likely wishful thinking and they may find that a faster liquidity drain (which is bullish for the U.S. dollar) is their only option to control the pricing pressures.
To that point, with energy prices increasingly unhinged and WTI on pace for its seventh-straight week of weekly gains, the S&P Goldman Sachs (NYSE:GS) Commodity Index has been on fire recently. For context, the S&P GSCI contains 24 commodities from all sectors: six energy products, five industrial metals, eight agricultural products, three livestock products and two precious metals. However, energy accounts for roughly 54% of the index’s movement.
Please see below:
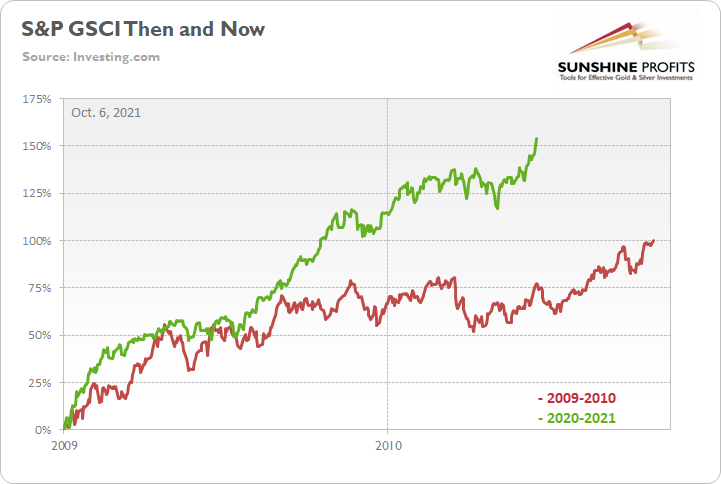
To explain, the green line above tracks the S&P GSCI’s current rally off of the bottom, while the red line above tracks the S&P GSCI’s rally off of the bottom in 2009-2010 (following the global financial crisis). If you analyze the middle of the chart, you can see that the S&P GSCI has completely run away from the 2009-2010 analogue. For context, at this point in 2009-2010, the S&P GSCI had rallied by 77% off of the bottom. However, as of the Oct. 5 close, the S&P GSCI has now rallied by 154% off of the April 2020 bottom.
Furthermore, with higher energy and materials prices exacerbating the cost-push inflationary spiral, signs of stress remain abundant. For example, IHS Markit released its U.S. Manufacturing PMI on Oct. 1. And while the headline index declined from 61.1 in August to 60.7 in September, Chris Williamson, chief business economist at IHS Markit, said that “prices charged for those goods leaving the factory gate also surged higher again in September, rising at a rate exceeding anything seen in nearly 15 years of survey history.”
Please see below:
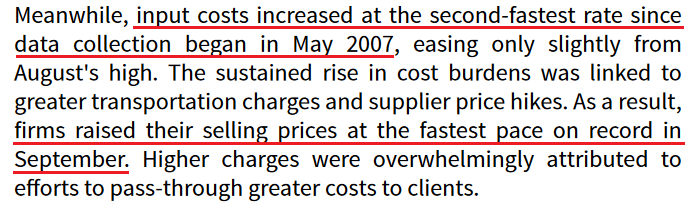
Source: IHS Markit
Singing a similar tune, the Institute for Supply Management (ISI) released its Services PMI on Oct. 5. For context, the U.S. service sector has suffered the brunt of the Delta variant’s wrath. And though pricing pressures aren’t as feverish as they are in the U.S. manufacturing sector, the report revealed that inflation increased at a “faster” pace and that “all 18 services industries reported an increase in prices paid during the month of September.”
In addition, PepsiCo (NASDAQ:PEP) released its third-quarter earnings on Oct. 5. And after beating analysts’ estimates on both the top and bottom lines, the beverage giant raised its full-year guidance. However, while demand remains resilient, 11.6% year-over-year consolidated net revenue growth coincided with a 3% decline in diluted earnings per share (EPS).
Despite that though, CEO Ramon Laguarta told analysts during the company’s Q3 earnings call that “what we're seeing across the world is much lower elasticity on the pricing that we've seen historically,” and as a result, price hikes are scheduled to commence in the coming months. For context, ‘elasticity’ attempts to quantify the change in demand that results from a change in price. And with CFO Hugh Johnston expecting charge inflation to outpace cost inflation going forward, “lower elasticity” is materially problematic for the Fed.
Please see below:
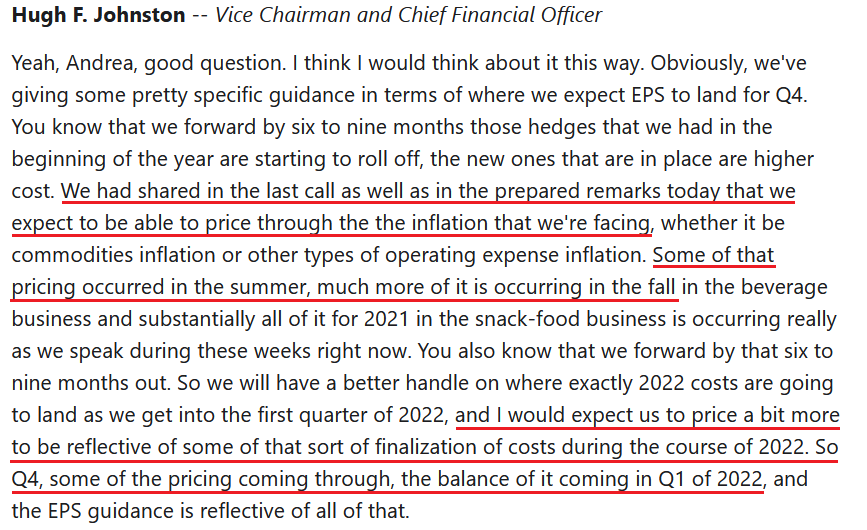
Source: PepsiCo/The Motley Fool
If that wasn’t enough, BMO Harris Bank announced on Oct. 5 that it will increase its minimum hourly wage for all branch and call-center employees by a “20 percent minimum” to $18 an hour. For context, BMO Harris Bank has more than 500 branches and more than 12,000 employees in the U.S.
Please see below:
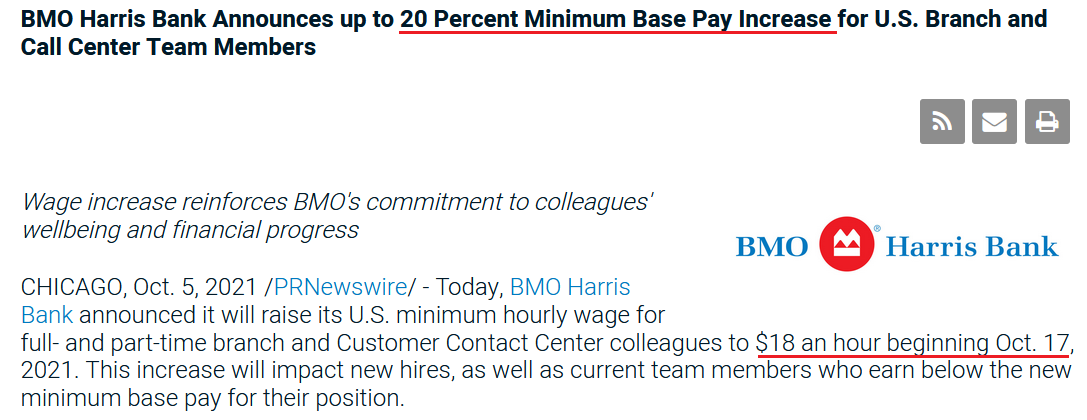
Source: BMO Harris Bank
More importantly, though, with Powell’s inflationary conundrum helping swing the double-edged sword that’s been fundamentally slashing precious metals, the USD Index rallied by 0.20% on Oct. 5 and U.S. Treasury yields strengthened across the board.
Please see below:

Source: Investing.com
As it relates to the dollar story, the USD Index’s fundamental strength is underwritten by the ‘dollar smile.’ To explain, when the U.S. economy is trudging along, the U.S. dollar tends to underperform. However, when the U.S. economy craters and a safe-haven bid emerges, the U.S. dollar often outperforms. Conversely (and similarly), when the U.S. economy is booming and higher interest rates materialize, the U.S. dollar also outperforms.
For context, I indicated on Sept. 22:
The USD Index and U.S. Treasury yields can move in the same direction or forge different paths. However, while a stock market crash is likely the most bearish fundamental outcome that could confront the PMs, scenario #2 is next in line. When U.S. economic strength provides a fundamental thesis for both the USD Index and U.S. Treasury yields to rise (along with real interest rates), the double-edged sword often leaves the PMs with deep lacerations.
To that point, with a mix of both playing out in the present, Sebastien Galy, senior macro strategist at Nordea, signalled clients that the dollar smile remains alive and well:
“The dollar should continue to be supported by expectations of an eventual series of Fed rate hikes and the value of the dollar as a safe haven against a potential equity correction…. The downward trend in EUR/USD is likely to return in the coming weeks and months, suggesting EUR/USD around the 1.10 handle and potentially below that before moving higher.”
As for the yield story, Lindsey Piegza, chief economist at Stifel Financial (NYSE:SF), told clients that “markets appear increasingly jittery as the realization of a higher sustained level of inflation eventually resulting in a higher level of rates appears to be finally sinking in.... Against the backdrop of elevated inflation and rapidly rising energy costs, many market participants are skeptical the FOMC will be able to maintain these low rates for another year, let alone two.”
The bottom line?
With inflation running away from the Fed, suppressing commodity prices (by strengthening the U.S. dollar and/or raising interest rates) is the only way to calm the inflationary pressures. If not, surging commodity prices will likely further suppress consumer confidence, upend corporate profit margins, culminate with demand destruction and the stock market should suffer mightily (which is also bullish for the U.S. dollar). As a result, with Powell creating an even larger inflationary wildfire the longer he waits, the precious metals could confront immense volatility over the medium term.
In conclusion, precious metals were mixed on Oct. 5, though trouble looms large in the months ahead. With the USD Index and U.S. Treasury yields ripe for upward re-ratings, the Fed’s “transitory” narrative hasn’t aged well. And with the precious metals’ main villains doing a lot of their fundamental damage since Powell turned hawkish, more upside catalysts should emerge over the medium term. As a result, precious metals’ outlook remains profoundly bearish over the next few months.