
Yesterday, Fed Chief Jerome Powell maintained his dovish stance, helping equities to rebound during the US session. However, this did not last for long, as this may have been largely anticipated. Inflation fears returned, and yields rebounded during the Asian session today.
Overnight, the RBNZ stood pat, projecting that interest rates may turn higher in December, something that helped the Kiwi to trade higher.
Inflation Fears Persist Despite Powell's Dovish Stance
The US dollar traded higher against the majority of the other G10 currencies on Tuesday and during the Asian session Wednesday. It gained the most versus CHF, JPY, SEK, and EUR, while it underperformed only versus NZD and GBP. The greenback was found virtually unchanged against CAD.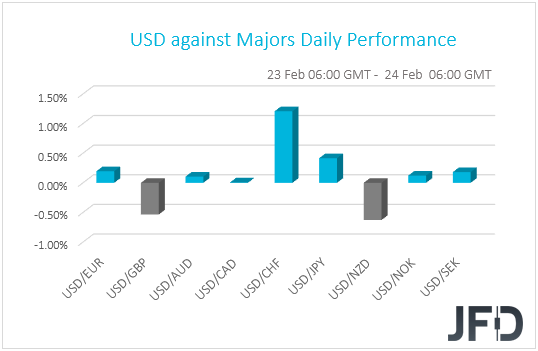
The weakening of the safe-havens franc and yen, combined with the strengthening of the risk-linked Kiwi, suggests that markets traded in a risk-on fashion yesterday and today in Asia. However, shifting our attention to the equity world, we see that this was not the case.
Major EU indices closed mixed, with Spain’s IBEX 35 being the main gainer and Germany’s DAX the main loser. In the US, both the DJIA and the S&P 500 ended their trading fractionally higher, but NASDAQ slid 0.50%. Today in Asia, market sentiment deteriorated further.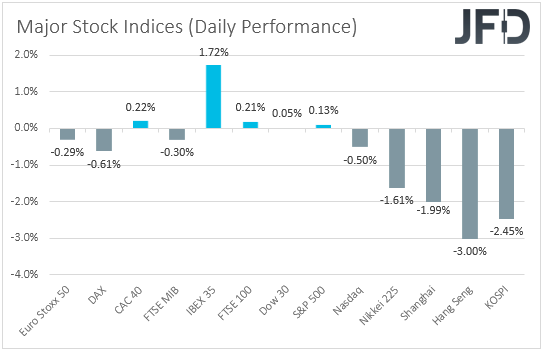
Yesterday, the main event on the agenda was Fed Chair Powell’s testimony before the Senate Banking Committee. The Fed Chief reiterated his stance that the economy is a long way from the employment and inflation goals, and that even if the labor market strengthens, the Committee will not tighten monetary policy solely in response to that.
With regards to scaling back QE purchases, he noted that they will clearly communicate “well in advance” any change, but they haven’t seen the desired progress yet. Basically, he maintained his dovish rhetoric, which may have been the reason behind the recovery in equities during the US session.
That said, as we noted yesterday, this was the base-case scenario. In other words, it may have been largely anticipated and thus, the rebound did not last for long. Inflation fears returned, and yields rebounded during the Asian session today.
S&P 500 Technical Outlook
After hitting the all-time high, at 3964, the S&P 500 index is now seen to be in a correction mode, as it makes its way towards the medium-term upside support line drawn from the low of Mar. 23. If that upside line can stay intact, the bulls might join the game again. For now, we will take a somewhat bullish approach.
A push further south, could bring the index to the 3818 hurdle, marked near the lows of Jan. 22 and Feb. 4, or to the aforementioned upside line. As mentioned above, if that upside line continues to provide good support, the buyers may join in and drive the S&P 500 back to the 3884 zone, marked near the lows of Feb. 10 and 18. If that zone is not able to withstand the uprise, the next possible target might be at 3964, which is the current all-time high.
Alternatively, if the S&P 500 breaks the aforementioned upside line and then also falls below the 3783 area, marked by the lows of Jan. 11 and 13, and also by the highs of Jan. 29 and Feb. 1, that may invite a few more sellers into the arena. The index could then slide to the 3711 obstacle, a break of which might set the stage for a test of the 3664 level, marked by the low of Jan. 31.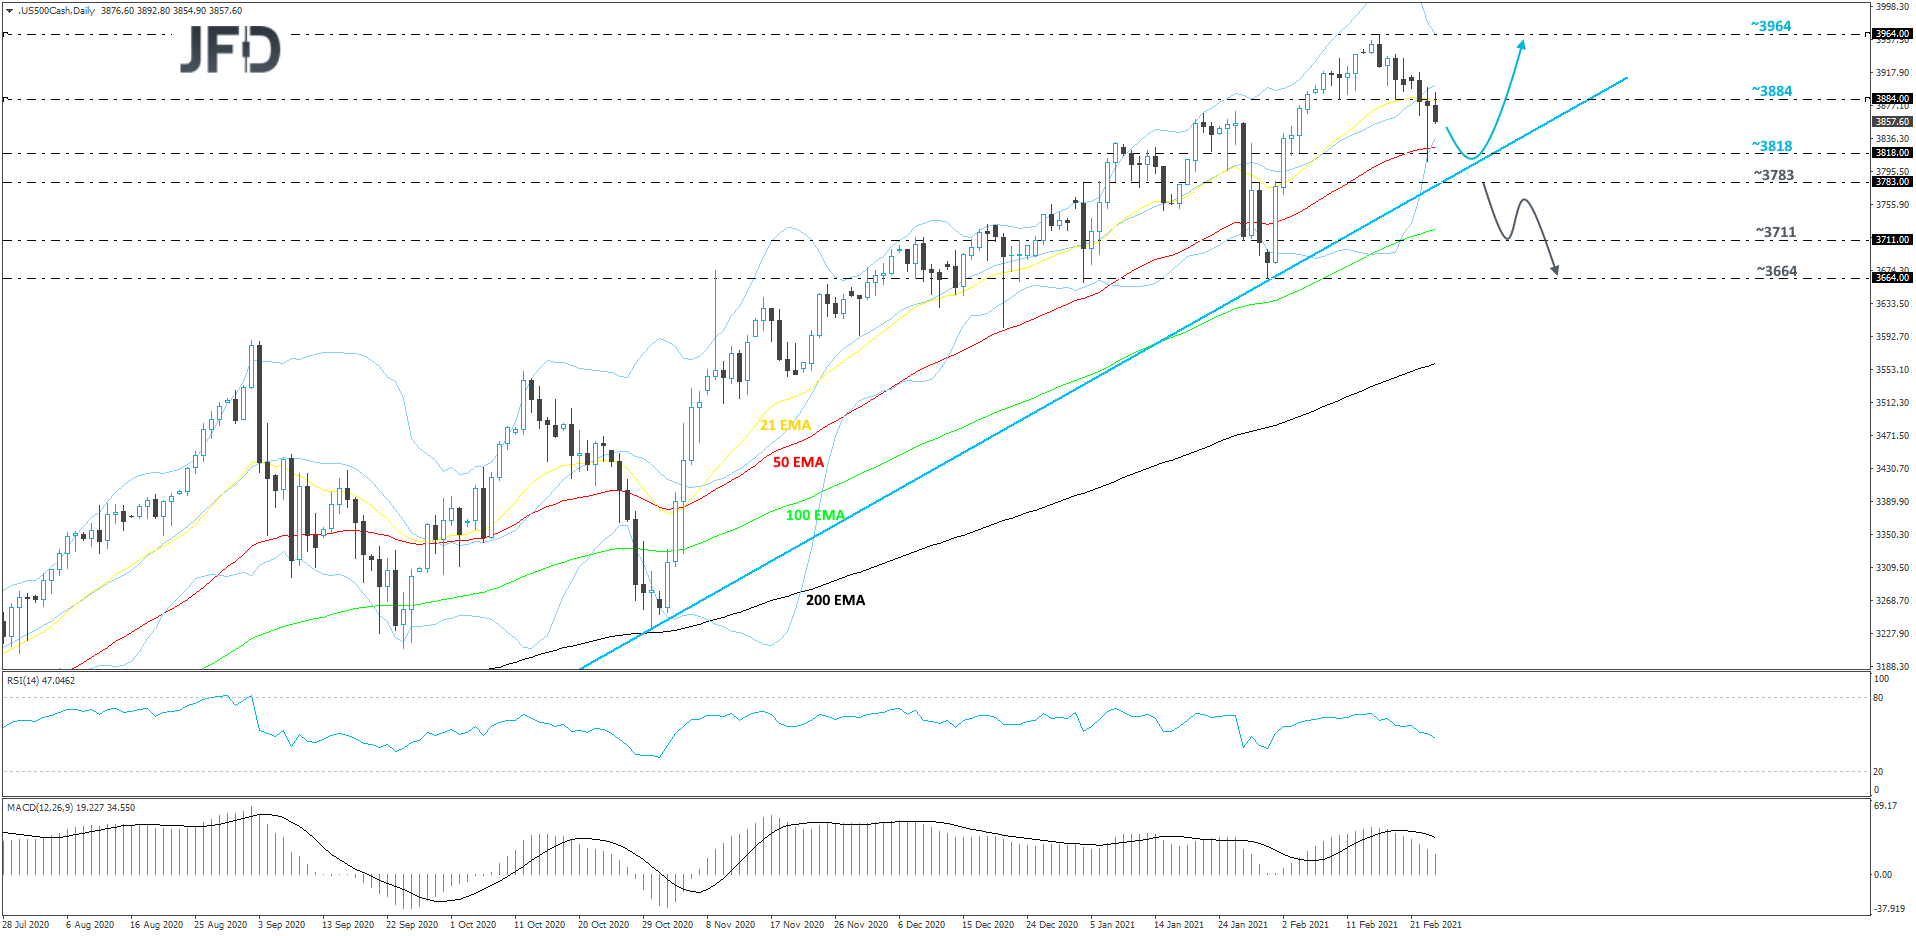
RBNZ Stands Pat, Sees Rates Turning Higher In December
Overnight, apart from the rising-yields theme, we also had an RBNZ monetary policy decision. The Bank decided to keep its official cash rate and its Large-Scale Asset Purchase program unchanged, noting that they agreed to stay prepared to provide additional support if necessary, with the options including a lower OCR. The Kiwi slid initially, perhaps as the statement may have revived speculation over negative interest rates by this Bank, but it was quick to rebound, recover the losses, and trade even higher, perhaps as investors started scanning the quarterly Monetary Policy Report, in which the economic forecasts showed the OCR turning higher from December.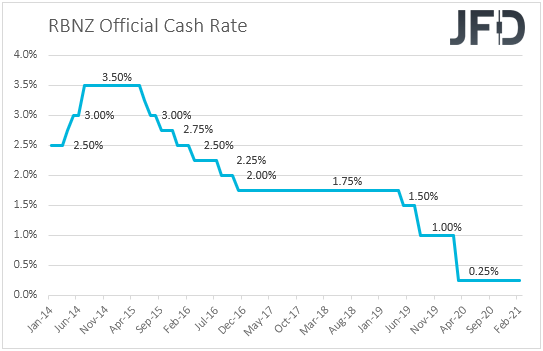
In our view, the probability for this Bank to adopt negative interest rates remains slim, though it is not zero. After all, at the press conference, Governor Adrian Orr said that negative rates remain an available option. That said, for now, due to the Bank’s own projections, we see the case for the Kiwi to stay supported. We also believe that with monetary policy around the globe set to stay accommodative in the months to come, risk sentiment may improve at some point soon, which could support risk-linked currencies like the Kiwi, especially against safe havens, like the yen. We see the case for equities to rebound as well. We will treat the current setback due to inflation fears as a corrective phase.
NZD/JPY Technical Outlook
NZD/JPY continues to run higher, while balancing above a couple of short-term upside lines. The slightly steeper one is drawn from the low of Feb. 18 and as long as the rate stays above that line, we will stay a bit more confident with larger advances in the near term. Hence our positive approach for now.
If the pair pushes a bit more to the upside, it may find resistance near the 77.96 hurdle, marked by the high of Dec. 14, 2018. The rate might stall there for a bit, or even correct back down. However, if NZD/JPY fails to break that line, the buyers could take advantage of the lower rate and lift it up again. If this time the pair is able to overcome the 77.96 obstacle, the next potential target might be at 78.30, marked by the high of Dec. 12, 2018.
In order to shift our attention to some lower areas, a break of the other upside line, which is drawn from the low of Jan. 28, would be required. In addition to that, a rate-drop below the 76.36 hurdle, marked by the high of Feb. 19, could increase the pair’s chances of drifting further south. We will then ai for the low of Feb. 17, at 75.79, a break of which might set the stage for a push towards the 75.35 level, marked by the low of Feb. 11.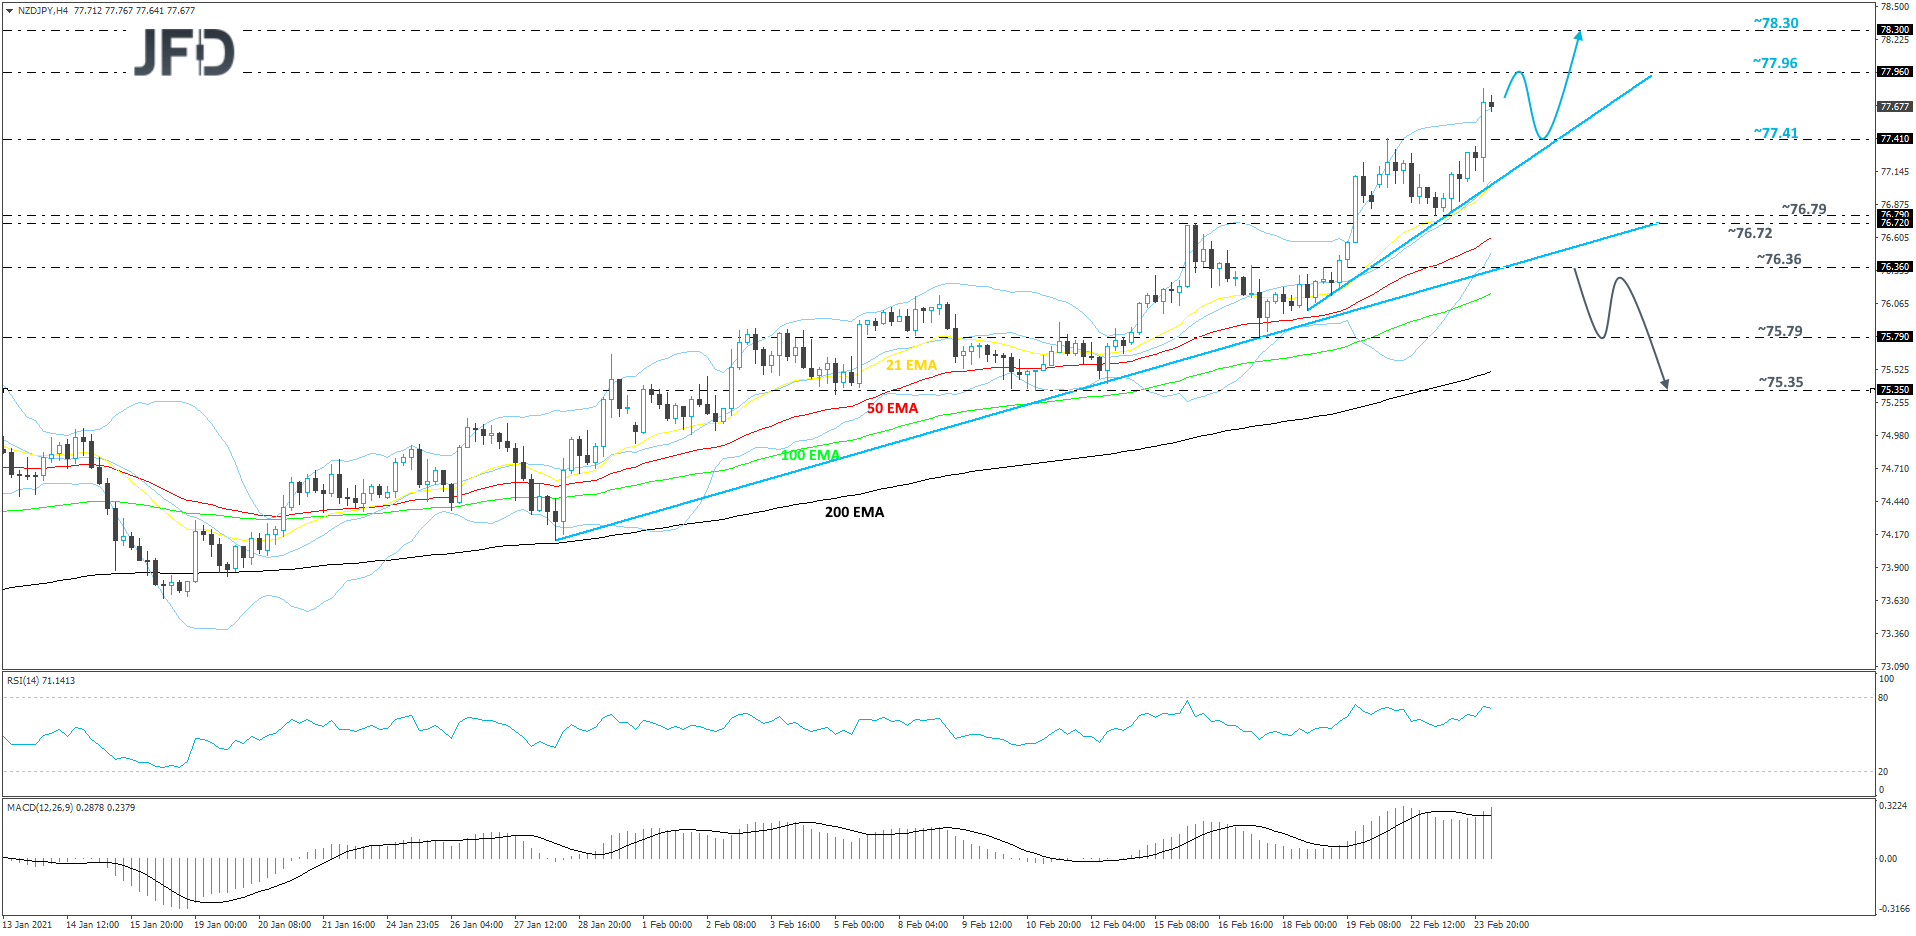
As For The Rest Of Today's Events
During the European session, we get Germany’s final GDP for Q4, which is forecast to confirm its preliminary estimate of +0.1% qoq. In the US, new home sales for January are expected to have accelerated to +2.1% mom from +1.6%, while the EIA (Energy Information Administration) is expected to show that crude oil inventories fell 5.190mn barrels last week, after falling 7.258mn the week before. That said, bearing in mind that the API (American Petroleum Institute) reported a 1.026mn barrels gain, we would consider the risks of the EIA forecast as tilted to the upside.
As for the speakers, Fed Chair Powell will present his testimony before the House Financial Services Committee, but we don’t expect him to say something new. We expect him to stick to his dovish stance. Apart from him, we will also get to hear from Fed Vice Chair Richard Clarida and BoE Chief Economist Andy Haldane.