Get 40% Off
🚨 Volatile Markets? Find Hidden Gems for Serious OutperformanceFind Stocks Now

Post-Christmas Market Plunge Cash-In

Published 12/27/2018, 11:14 PM
Updated 07/09/2023, 06:31 AM

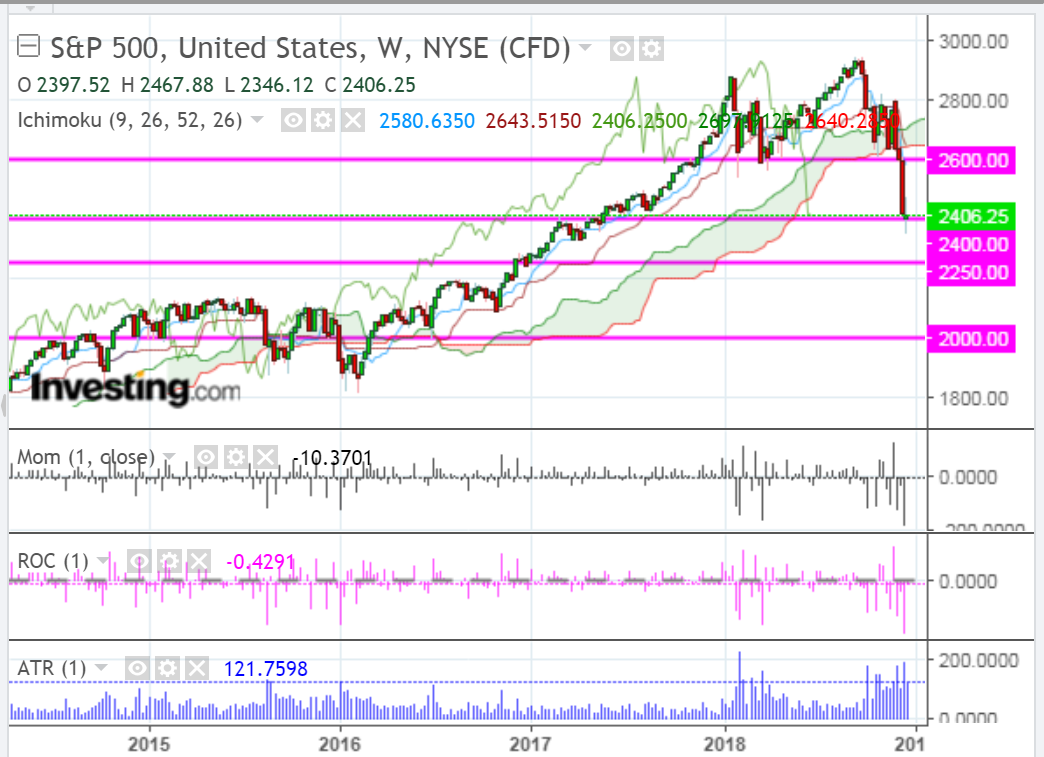
It appears that some short-sellers have cashed in the past couple of days and have stalled the plunge in the SPX, as shown on the following weekly chart.

As at 2:00 pm ET on Thursday (December 27), price is consolidating intraday just above near-term support of 2400. Major resistance sits at 2600 (just below the weekly Ichimoku Cloud formation), while the next level of support sits at 2250, followed by major support at 2000.

Whether that cash will be deployed in any sustained and meaningful buying any time soon, or whether it's sitting ready for shorting again, remains to be seen. Conditions are very unstable, as depicted on the three technical indicators (each with an input value of "one" and in histogram format to illustrate that volatility and its strength).
S&P 500 Chart

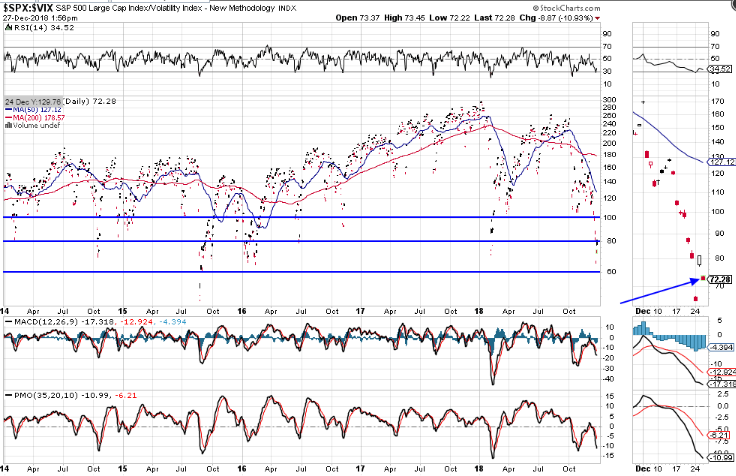
Price on the SPX:VIX ratio is still below 80.00, as shown on the following daily ratio chart. As long as it remains below 100, we're going to see continued large, volatile daily gyrations in the SPX. A drop and hold below 60.00 would likely accompany a swift price-drop in the SPX to 2250 or 2000.
SPX-VIX Chart

Latest comments

Risk Disclosure: Trading in financial instruments and/or cryptocurrencies involves high risks including the risk of losing some, or all, of your investment amount, and may not be suitable for all investors. Prices of cryptocurrencies are extremely volatile and may be affected by external factors such as financial, regulatory or political events. Trading on margin increases the financial risks.
Before deciding to trade in financial instrument or cryptocurrencies you should be fully informed of the risks and costs associated with trading the financial markets, carefully consider your investment objectives, level of experience, and risk appetite, and seek professional advice where needed.
Fusion Media would like to remind you that the data contained in this website is not necessarily real-time nor accurate. The data and prices on the website are not necessarily provided by any market or exchange, but may be provided by market makers, and so prices may not be accurate and may differ from the actual price at any given market, meaning prices are indicative and not appropriate for trading purposes. Fusion Media and any provider of the data contained in this website will not accept liability for any loss or damage as a result of your trading, or your reliance on the information contained within this website.
It is prohibited to use, store, reproduce, display, modify, transmit or distribute the data contained in this website without the explicit prior written permission of Fusion Media and/or the data provider. All intellectual property rights are reserved by the providers and/or the exchange providing the data contained in this website.
Fusion Media may be compensated by the advertisers that appear on the website, based on your interaction with the advertisements or advertisers.
© 2007-2024 - Fusion Media Limited. All Rights Reserved.