Turkish equities are at critical support levels from where they can see a possible turnaround. We are talking about a country and financial markets that experienced a failed coup, an S&P downgrade and a recently declared state of emergency. Yet the magnitude of the correction is less than what BIST 100 experienced after the Gezi Park protests in 2013 and much smaller in magnitude when compared with the banking crises in 2000-2003 and the global financial melt-down in 2007-2008. Is it possible to say the worst is over?
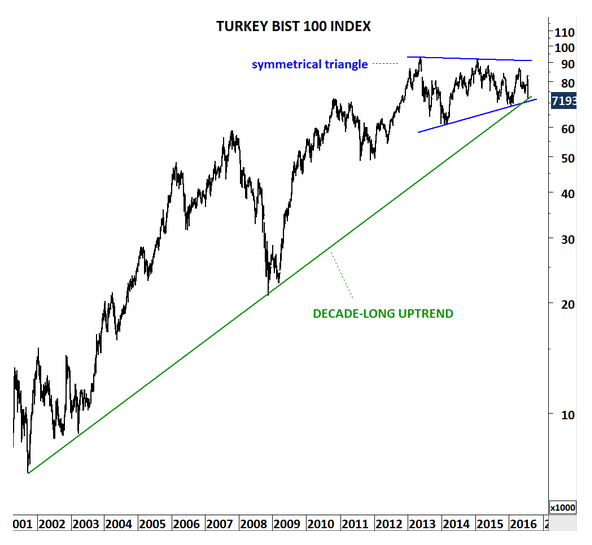
Long-term chart of the BIST 100 index shows the multi-year long uptrend being tested between 70K-72K area. This is also the lower boundary of a larger scale sideways correction which I label it as a symmetrical triangle.
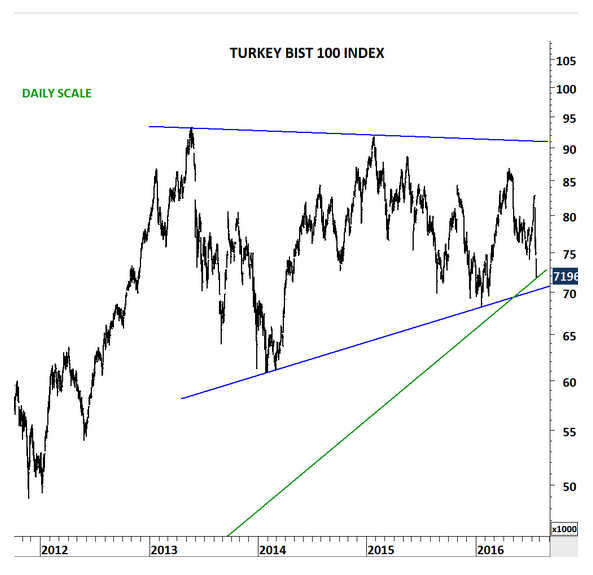
Daily chart shows the 3-year-long sideways consolidation. After the recent sell-off the BIST 100 index is now very close to strong support area between 70K and 72K. Unless we see a breakdown below the strong support area, we will expect a rebound and a possible reversal.
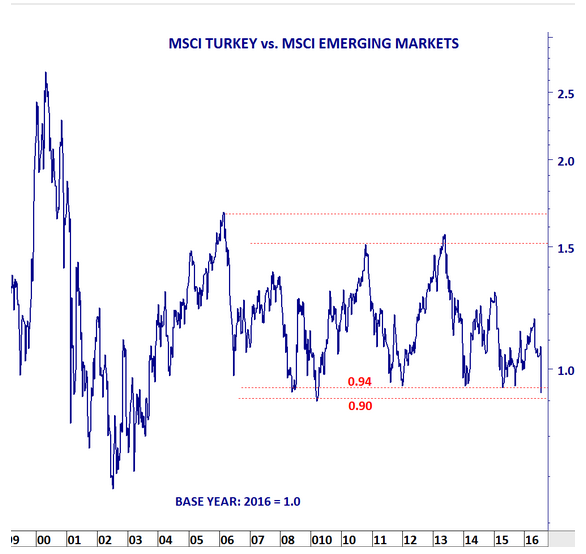
MSCI Turkey has underperformed MSCI Emerging Markets index. Though, the ratio between MSCI TURKEY and MSCI EM is now at a major support level. This ratio is indexed to 1 with the base year being 2016. Since the beginning of the year, including the latest sell-off the ratio stands at 0.92. This is 8% underperformance versus the MSCI EM. More important than the numbers, I think the level of the ratio suggests a possible reversal. Unless there is a breakdown below 0.90-0.94 area, being long Turkey versus MSCI EM at this inflection point could be a low risk trade.
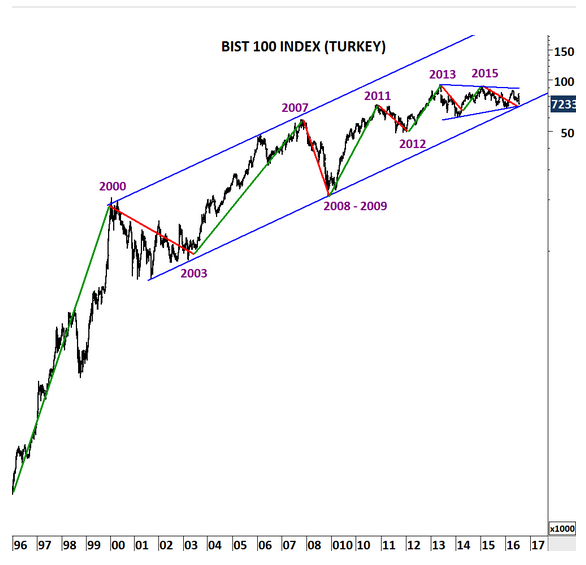
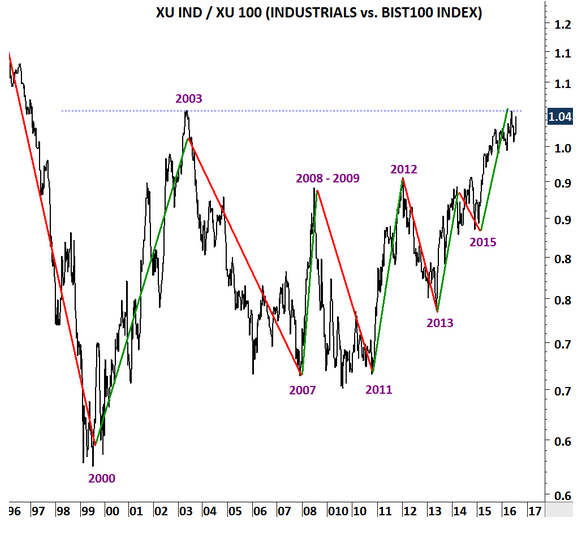
Corrections led by a financial/economic cause has been deeper and more lengthy when compared with corrections led by political turmoil. Recent data from 1996 till today supports this conclusion. 2000-2003 was the banking crisis in Turkey. 2007-2008 was the global financial melt-down. Both has been the major corrective periods on BIST 100 index. 2011-2012 was related to the global recession fears and the global equity corrections. Since 2013, BIST 100 is in a sideways consolidation.
During each corrective period, Industrials outperformed the BIST 100 index. In other words Financials have underperformed. Risk on trade for Turkish equities have always been buying the financials. Industrials have been a defensive play. The ratio between Industrial Index and BIST 100 reached 2003 levels. If there is a turnaround (a market reversal), you should keep an eye on the performance of financials in the coming weeks. This ratio should also reverse from 2003 levels.
Several charts above suggests equity markets in Turkey are at a major turning point. If we see stability at these levels I'll weigh going long Turkey.
