Monthly S&p 500 Emini futures candlestick chart:
Trump rally and January Effect continues

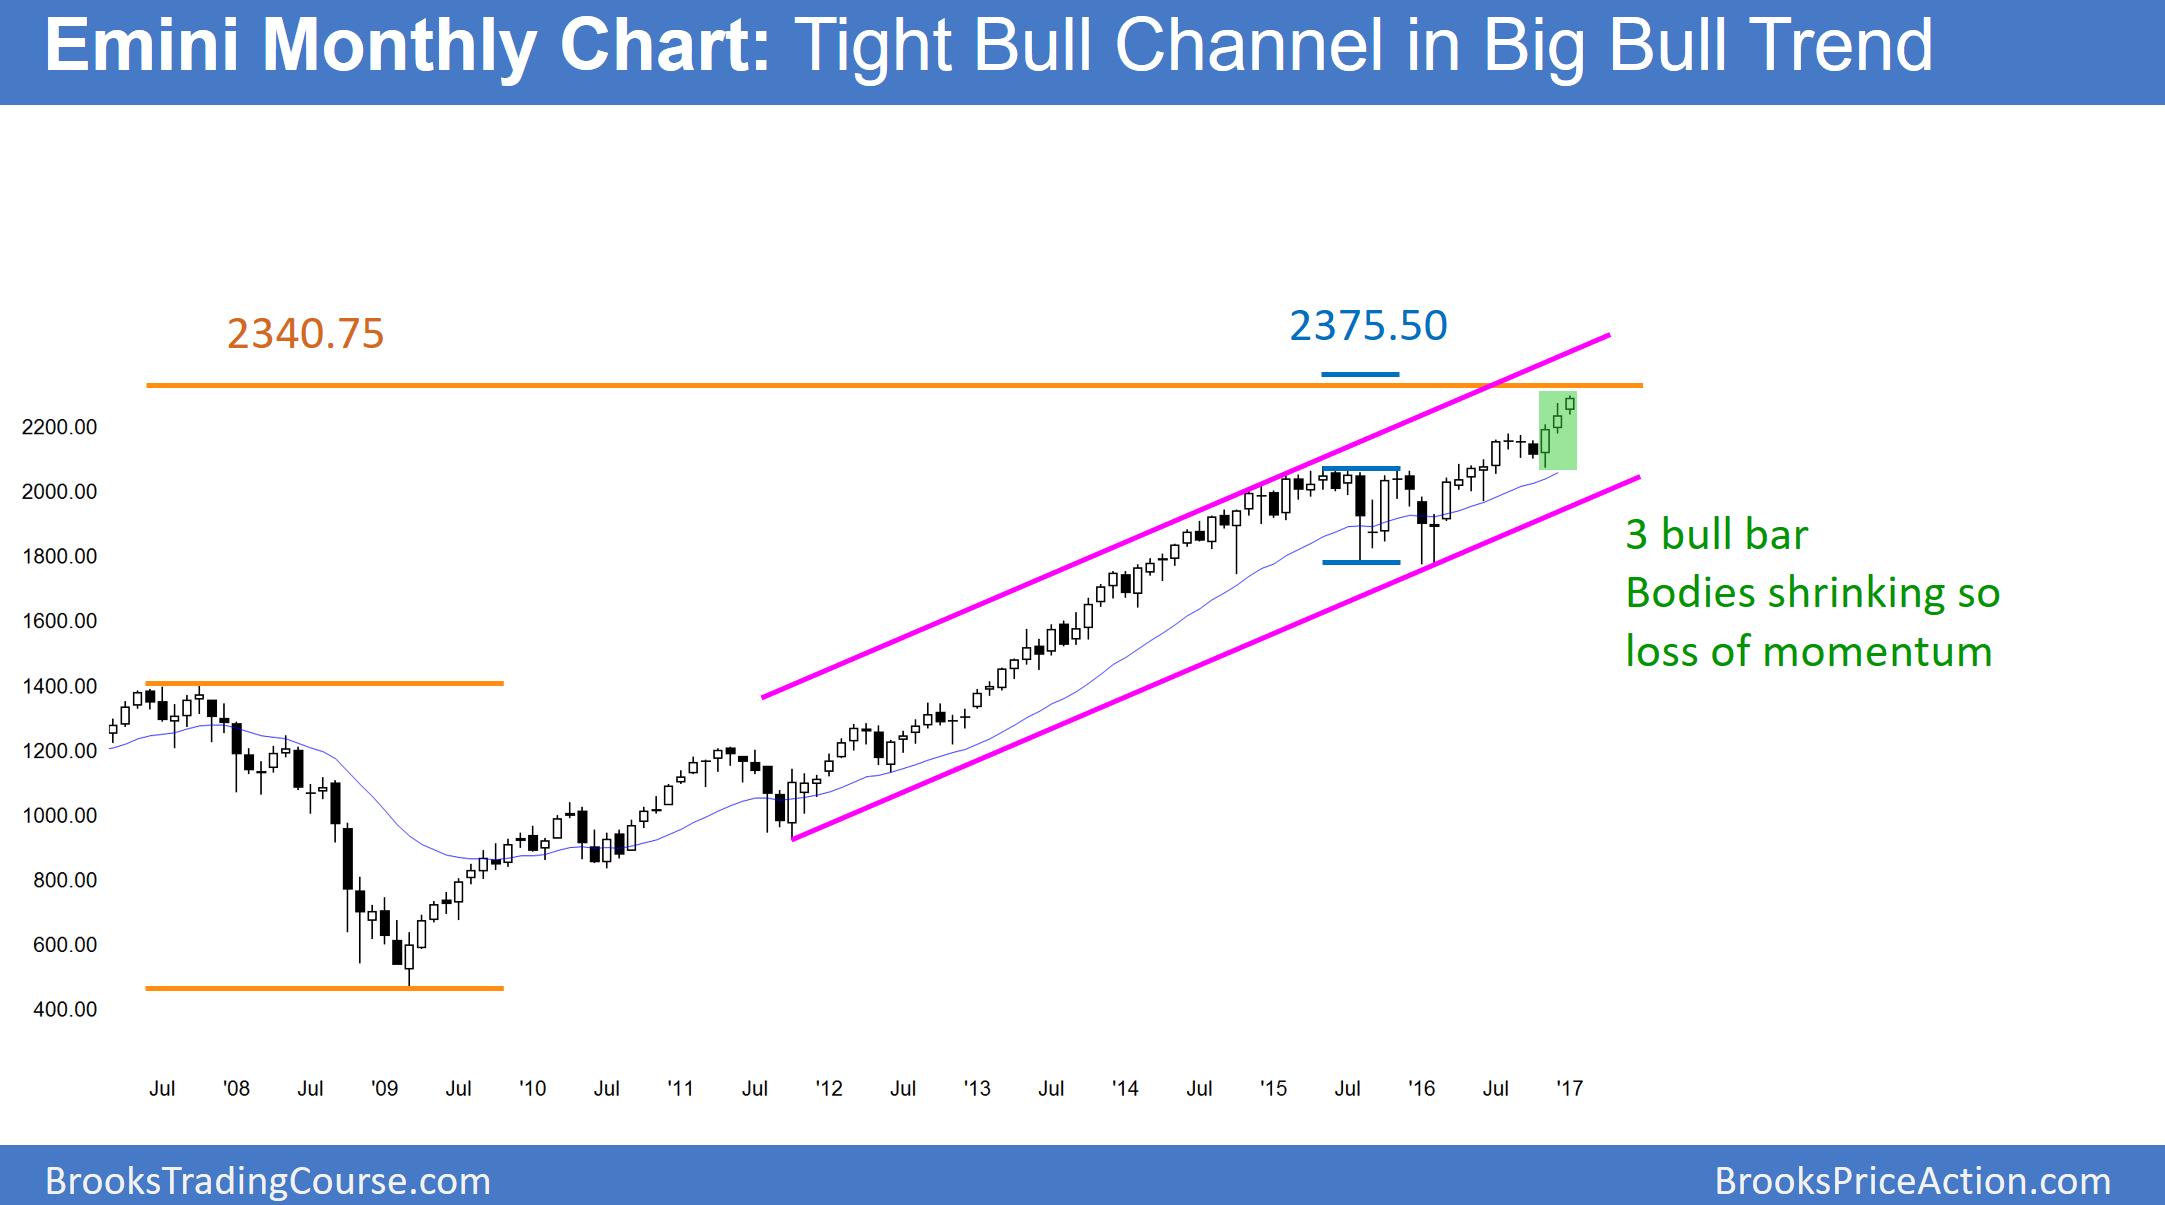
The monthly S&P 500 Emini futures candlestick chart has a bull body this month. This is the 3rd month in the breakout and there is no sign of a top yet.Yet the bodies are shrinking and therefore represent some loss of momentum.
The monthly S&p 500 Emini futures candlestick chart is continuing up. In addition, the Dow broke strongly over the big round 20,000 number, which is an important psychological market. The bears will probably need at least a micro double top before they can create a reversal. Since that would take 2 – 3 months, the odds favor more sideways to up trading. Furthermore, there are measured move targets on the monthly chart between 2340 and 2370. Hence, there are magnets pulling the Emini higher.
Weekly S&p 500 Emini futures candlestick chart:
Breakout above bull flag

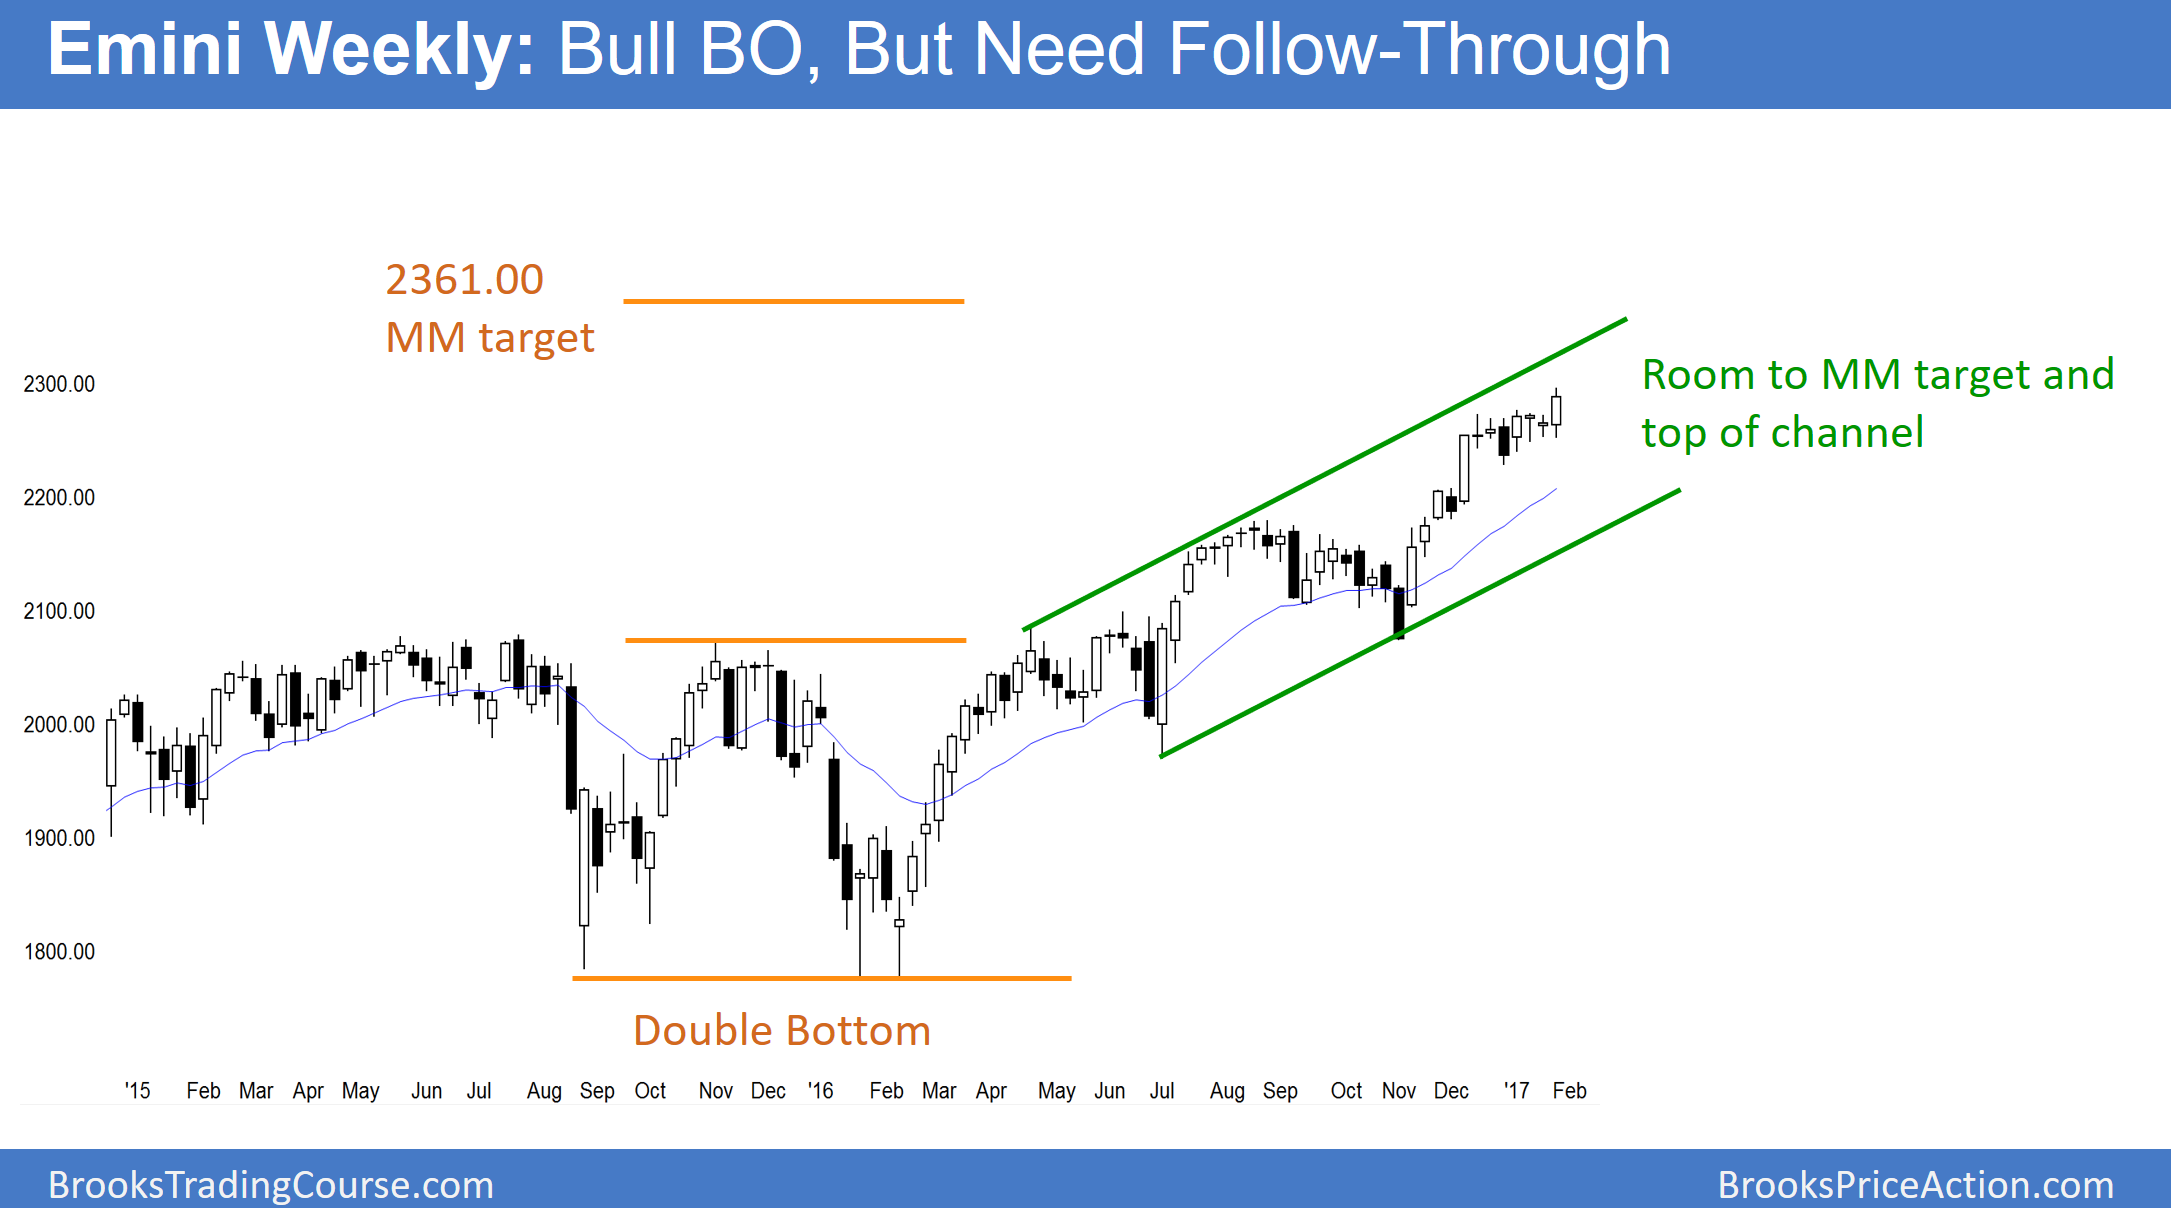
The weekly S&p 500 Emini futures candlestick chart had a big bull trend bar this week. It therefore had a strong breakout above a bull flag. Yet it needs follow-through buying next week, or traders will wonder if the breakout will fail.
The weekly S&p 500 Emini futures candlestick chart broke above a bull flag this week. Because the breakout bar was a big bull bar that closed near its high, the bulls are strong. Therefore, the Emini will probably continue at least a little higher over the next few weeks.
Since any breakout can fail, the bears will try to reverse the breakout next week. Because the breakout was strong, the bears only have a 40% chance of success. More likely, the best they will be able to get is a pullback. Hence, that would be a bull flag.
There are targets above and the Emini will probably continue higher.
Daily S&p 500 Emini futures candlestick chart:
Possible Island Top and 5% stock market correction

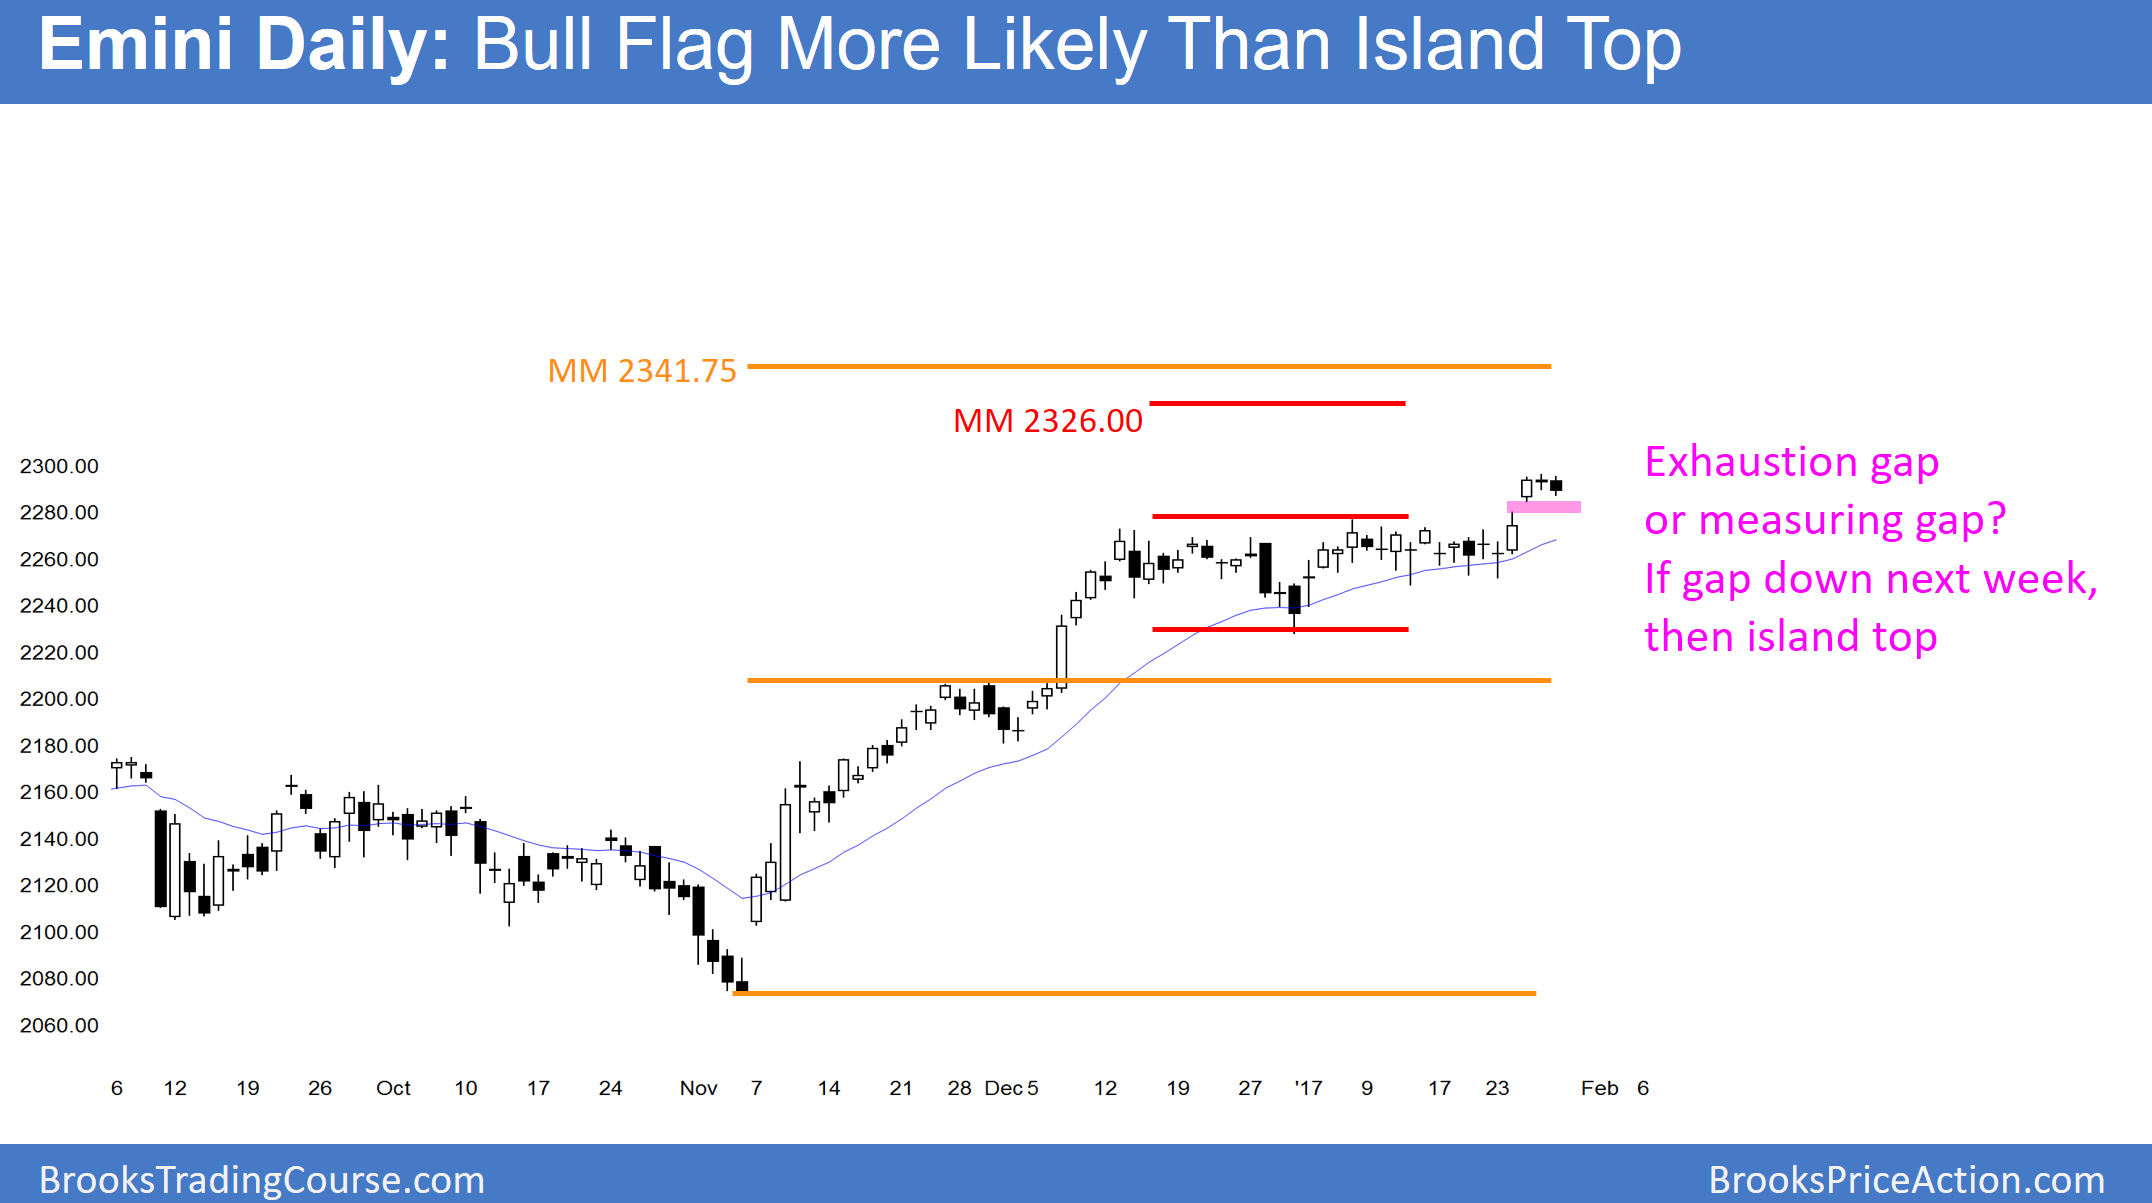
The daily S&p 500 Emini futures candlestick chart gapped up this week to a new all-time high. Yet, it has been sideways for days. If the Emini gaps down next week, that gap would create an island top. If it simply trades down and closes the gap, the gap becomes an exhaustion far. More likely, it will be a bull flag and lead to higher prices.
The daily S&p 500 Emini futures candlestick chart had been in a tight trading range for 6 weeks before this week’s breakout. Since the 6 week tight trading range is late in the bull trend, it might be the final bull flag. Hence, a reversal down next week could be the start of a selloff down to test support.
Last year closed near its high, which is now support. In addition, this year rallied from the beginning. The odds are that the Emini will test last year’s close at some point this year. That would be a 50 point correction from the current level.
Furthermore, the Emini broke strongly above the August high. Because it has not been tested by a pullback, there is a gap above that high and below the current price. Since gaps late in bull trends usually close, the odds are that the Emini will trade down to the August high within the next couple of months. That would be about a 5% or 100 point correction.
Possible island top
Whenever the Emini gaps up to a new high, traders watch for a gap down at any point over the next several weeks. If they see it, the bars between the gap up and then the gap down create an island top. Hence, the odds of a reversal down would increase. Most island tops and bottoms do not lead to reversals. They therefore are like all tops and bottoms. Most reversals fail and lead to trading ranges, and not opposite trends. Yet, they increase the probability of a reversal.
Bears will watch for several things next week. They want either a gap down or a series of big bear trend bars. Furthermore, if there is a gap down, they then want several bear bars. Since weak follow-through selling is a sign of weak bears, if the bears fail to create big bear bars, the odds would favor a pullback instead of a trend reversal.
While there is a 60% chance of a 50 – 100 point pullback over the next couple of months, there is no top yet. Yet, the selloff will probably come before the monthly chart reaches its targets between 2340 – 2375.
If the bears get their test of the August high, bulls will probably buy the test. Hence, there would probably be a rally that would last at least several weeks. The odds still favor at test of the monthly 2340- 2375 target area this year, whether or not the Emini falls 100 points first.
FOMC Meeting creates uncertainty
There is an important FOMC meeting on Wednesday. It is important because the Fed began increasing interest rates at the last meeting. Traders want an idea of how often the Fed will raise rates this year. The consensus is 2 more times. Therefore, if the wording makes traders think more is likely, they will be less willing to buy stocks, and more interested in safer alternatives, like CDs.
The meeting creates uncertainty, which is a hallmark of a trading range. Hence, the Emini might stay sideways into the report. Yet, the odds are that there will be a big move after the report. The move can be up, down, or in both directions.
