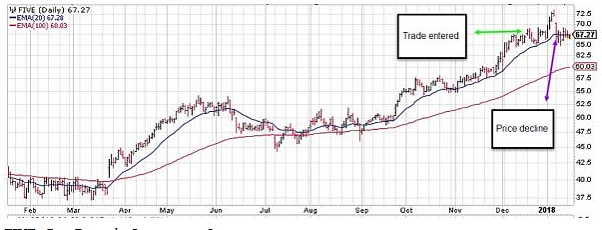
Exit strategy preparation and implementation is one of the 3 required skills for successful covered call writing and put-selling. Because of the time value erosion of our options (Theta), there are limitations regarding the exit strategy opportunities as our contracts near expiration. In January 2018, Duminda contacted me about a trade he executed with Five Below Inc (NASDAQ:FIVE) that appeared to head south late in the contract month.
Duminda’s trade
- 12/18/2017: Buy 100 x FIVE at $68.66
- 12/18/2017: Sell 1 x $70.00 call at $2.25
- 1/8/2018: FIVE gaps down to $65.00 on a downbeat profit forecast
- 1/8/2018: The cost-to-close the $70.00 call is $0.80
- 1/18/2018: Stock price is $66.96 (the day this article is being written)
FIVE gap-down in January 2018

Exit strategy opportunities?
Buy-to-close the short call
Since we are in the second half of the January contracts, the 20%/10% guidelines for closing the short call points us to a buy-to-close price in the $0.23 area (10% of $2.25). The current cost–to-close is $0.80, well above that threshold.
Close the entire position if news is egregious or well-under-performing the S&P 500
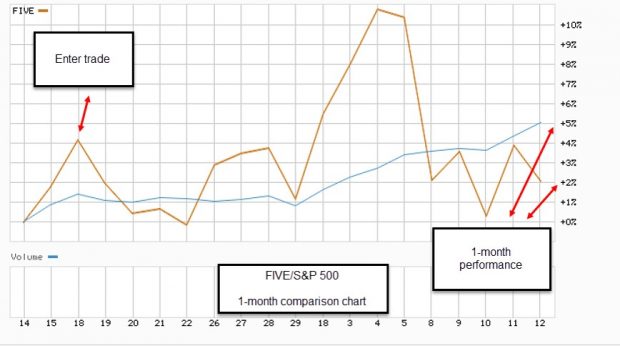
Although negative earnings guidance can cause a temporary hit in share price, it can also be related to creating a softer landing when the actual earnings report is released. Also, the stock started to rebound shortly after the gap-down. The stock was slightly under-performing the S&P 500 when viewing a 1-month chart (+2% to +5%), also not enough of a discrepancy to make selling the stock an obvious path to take.

Take no action
Given that the 20%/10% guidelines were not met, the stock price began to recover and the 1-month comparison chart with the S&P 500 was not strongly bearish, this is a reasonable path to consider.
Calculations
Initial time value return (ROO)
$2.25/$68.66 = 3.3%
Cost-to-close on 1/8/2018
$0.80/$68.66 = 1.2%
Trade results as of 1/18/2018 taking no action
$225.00 (option premium-per-contract) – $170.00 (current share value loss) = + $55.00 = 0.8% 1-month return = 9.6% annualized
Discussion
Position management implementation may not always be obvious. By adhering to a structured system that has its basis in sound fundamental, technical and common-sense principles, we will make the best choices in most circumstances. In this article, we used fundamental news, review of price charts, comparison charts and use of our 20%/10% guidelines to determine that sometimes the best action is no action at all.
Thanks to Duminda for sharing this trade with our BCI community.
Market tone
This week’s economic news of importance:
- Job openings June 6.7 million (6.7 million last)
- Consumer credit June $10 billion ($24 billion last)
- Weekly jobless claims 8/4 213,000 (217,000 expected)
- Producer price index July Wholesale inventories June 0.0% (0.2% expected)
- Consumer price index July 0.2% (as expected)
- Core CPI July 0.2% (as expected)
THE WEEK AHEAD
Mon August 13th
- Survey of consumer expectations July
Tue August 14th
Wed August 15th
- Retail sales July
- Productivity Q2
- Industrial production July
- Home builders’ index August
- Business inventories June
Thu August 16th
- Weekly jobless claims 8/11
- Housing starts July
- Building permits July
- Philly Fed Index August
Fri August 17th
- Consumer sentiment Aug
- Leading economic indicators July
For the week, the S&P 500 moved down by 0.2% for a year-to-date return of 5.97%
Summary
IBD: Market in confirmed uptrend
GMI: 6/6- Bullish signal since market close of July 9, 2018
BCI: Using an equal number of in-the-money and out-of-the-money strikes. Impact of foreign currency issues, tariffs/trade wars unclear.
WHAT THE BROAD MARKET INDICATORS (S&P 500 AND VIX) ARE TELLING US
The 6-month charts point to a bullish tone. In the past six months, the S&P 500 was up 6% while the VIX (13.16) down by 48%.
Wishing you much success,
