
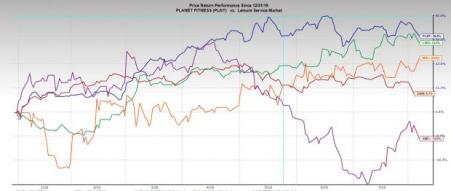
Planet Fitness (NYSE:PLNT) is reporting its second quarter earnings on Tuesday after the closing bell. The company has had a solid year thus far, with shares up 38.6% year-to-date, outpacing the broader leisure services market. Planet Fitness had a strong first quarter and is looking to continue its success with a solid Q2. The company provides contract free gym memberships at a low rate that appeals to the new health conscious consumer. Can the gym giant continue its success in the second half of 2019? Let’s look at how Zacks estimates have the company doing in Q2.
Overview and Q1 Recap
Planet Fitness, headquartered in Hampton, New Hampshire, was formed in 1992 and is one of the leading franchisors and operators of fitness centers in the United States. At the end of 2018, the company had roughly 12.5 million members as well as 1742 stores in 50 states, Puerto Rico, Canada, Mexico, and other countries. Out of the 1742 stores, 1666 are franchised and the remaining 76 are corporate owned. Company franchisees are planning on opening more than 1000 stores. PLNT reports its financial performance under four main segments: Franchise, Corporate-Owned, Commission, and the Equipment segment.
In Q1, PLNT beat earnings estimates by 2.9% with EPS of $0.35. Sales, however, fell short of estimates by 2.6% to $148.8 million but jumped 22.7% year over year. Q1 2019 marked the 41st straight quarter that the company had positive same store sales, jumping 10.2%. The franchise segment jumped 25.6% to $52.96 million while the corporate owned stores brought in $38.04 million for a 16.3% increase. The equipment segment increased 32.3%, generating $45.01 million. Commission income saw a decline, plummeting 50% to $994K in Q1. The company’s national advertising fund revenue reeled in the remaining $11.8 million, gaining 12.9% from Q1 2018. 65 new Planet Fitness centers were opened during the quarter, bringing system-wide total stores to 1806 to close the quarter.
Q2 Outlook
For Q2, estimates are calling for a bottom-line increase of 20.59% to $0.41 per share, with a top-line leap of 19.35% to $167.75 million in Q2. Our Key Company Metric estimates are projecting for Franchise revenue to increase 27.6% to $57.97 million and for corporate-owned stores to generate $38.97 million for a 13.8% jump. Commission income is expected to continue its decline with a 20.3% drop to $1.26 million. The equipment segment is expected to remain strong, rallying 21.3% to $58.82 million. NFM estimates are predicting for the company to open 43 new stores which would bring the total to 1861 in Q2.
Planet Fitness shares have been outperforming its industry as its earnings trends and same-store sales performance have fueled its returns. Increases in net member and higher average royalty rate has been driving comparable sales. The company’s platform of commitment free fitness greatly appeals to modern health conscious consumers that don’t wish to be bogged down to a gym for a prolonged period of time. Its strong number of stores in the United States bodes well for its black card members that have access to all PLNT clubs. Despite the already solid club presence within the U.S., Planet Fitness has continued to expand its brand presence through strategic partnerships. For Example, PLNT plans to open 10 new stores through its Kohl’s partnership. PLNT is a Zacks Rank #2 (Buy) and has outperformed some of its industry peers such as Lindblad Expeditions (NASDAQ:LIND) , Studio City (NYSE:MSC) , and AMC Entertainment (NYSE:AMC) YTD.
Today's Best Stocks from Zacks
Would you like to see the updated picks from our best market-beating strategies? From 2017 through 2018, while the S&P 500 gained +15.8%, five of our screens returned +38.0%, +61.3%, +61.6%, +68.1%, and +98.3%.
This outperformance has not just been a recent phenomenon. From 2000 – 2018, while the S&P averaged +4.8% per year, our top strategies averaged up to +56.2% per year.
See their latest picks free >>
Lindblad Expeditions Holdings Inc. (LIND): Free Stock Analysis Report
AMC Entertainment Holdings, Inc. (AMC): Free Stock Analysis Report
Planet Fitness, Inc. (PLNT): Free Stock Analysis Report
STUDIO CITY IH (MSC): Free Stock Analysis Report
Original post
Zacks Investment Research