
Phillips 66 (NYSE:PSX) Partners LP’s (NYSE:PSXP) fourth-quarter 2019 earnings per unit came in at $1.06, which beat the Zacks Consensus Estimate of 99 cents owing to increased volumes on the partnership’s terminals and a full quarter contribution from the isomerization unit at the Lake Charles Refinery. However, earnings deteriorated from the year-ago quarter’s figure of $1.09 due to higher expenses.
Revenues of $432 million rose from $393 million in the year-ago quarter and also beat the Zacks Consensus Estimate of $419 million. The upside can be attributed to higher volumes and average realizations.
Operating Information
The partnership provides services through Pipelines, Terminals and Storage as well as Processing & Other activities.
Pipeline: In fourth-quarter 2019, the partnership generated revenues of $126 million, up from $118 million in the prior-year quarter. The uptick was led by higher average pipeline revenues of 67 cents per barrel compared with 61 cents per barrel in the year-ago quarter.
Terminals: The partnership generated $47 million, up $43 million from the year-ago quarter. The upside came on the back of higher throughput volumes of refined petroleum products.
Storage, Processing & Other activities: Through these activities, the partnership generated revenues of $118 million, up from $109 million in the year-ago quarter.
Operating and Maintenance Expenses
In the December quarter of 2019, the partnership reported operating and maintenance expenses of $90 million, up from $88 million in the year-ago quarter.
Balance Sheet
As of Dec 31, 2019, the partnership recorded cash and cash equivalents of $286 million. Also, total debt at the end of the quarter under review was $3,516 million.
Phillips 66 Partners LP Price, Consensus and EPS Surprise
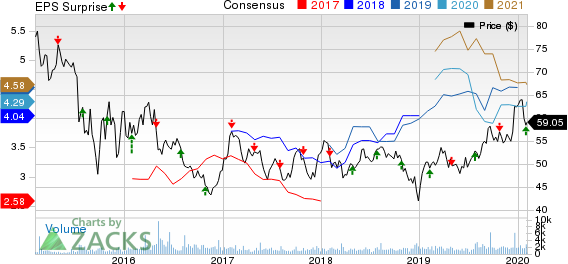
Phillips 66 Partners LP price-consensus-eps-surprise-chart | Phillips 66 Partners LP Quote
Strategic Update & Outlook
Phillips 66 Partners has various ongoing projects that are backed by long-term volume commitments and expected to deliver typical midstream returns.
Gray Oak pipeline is operating in sync with expectations and expected to reach full service in the second quarter of 2020. It commenced initial operations on the 900,000 barrels per day (BPD). It will transport crude oil from the Permian and Eagle Ford to Texas Gulf Coast destinations. Phillips 66 Partners has a 42.25% ownership in the pipeline.
Sweeny to Pasadena capacity expansion project will add 80,000 BPD of pipeline capacity, providing additional naphtha offtake from the Sweeny fractionators. In addition, product storage capacity will increase by 300,000 barrels at the Pasadena Terminal. The project is expected to start by second-quarter 2020.
South Texas Gateway Terminal, in which Phillips 66 Partners owns a 25% interest, is expected to be completed by third-quarter 2020. The marine export terminal will have two deep-water docks, with storage capacity of 8.5 million barrels and up to 800,000 BPD of throughput capacity.
Clemens Caverns storage capacity expansion from 9 million barrels to 16.5 million barrels is expected to be completed in fourth-quarter 2020 while C2G Pipeline, which is a 16-inch ethane pipeline that will connect Clemens Caverns to petrochemical facilities in Gregory, Texas, near Corpus Christi. The unit is likely to commence operations by mid-2021.
The partnership has earmarked total capex of $867 million for 2020, which includes $734 million for growth projects and $133 million of maintenance capital. It expects to exit 2020 with EBITDA run rate of $1.5 billion.
Zacks Rank & Stocks to Consider
Phillips 66 Partners currently carries a Zacks Rank #3 (Hold). Few better-ranked players in the energy space are California Resources Corporation (NYSE:CRC) , Suncor Energy (NYSE:SU) and Marathon Oil Corporation (NYSE:MRO) . All the stocks carry a Zacks Rank #2 (Buy). You can see the complete list of today’s Zacks #1 Rank (Strong Buy) stocks here.
California Resources Corporation has trailing four-quarter positive earnings surprise of 711.1%, on average. The company’s earnings beat the Zacks Consensus Estimate in three of the last four quarters.
Suncor Energy has trailing four-quarter positive earnings surprise of 2.2%, on average. The company’s earnings beat the consensus mark in two of the last four quarters.
Marathon Oil Corporation has trailing four-quarter positive earnings surprise of 197.8%, on average. The company’s earnings beat the consensus mark in all of the last four quarters.
7 Best Stocks for the Next 30 Days
Just released: Experts distill 7 elite stocks from the current list of 220 Zacks Rank #1 Strong Buys. They deem these tickers “Most Likely for Early Price Pops.”
Since 1988, the full list has beaten the market more than 2X over with an average gain of +24.7% per year. So be sure to give these hand-picked 7 your immediate attention.
See 7 handpicked stocks now >>
Phillips 66 Partners LP (PSXP): Free Stock Analysis Report
Suncor Energy Inc. (SU): Free Stock Analysis Report
California Resources Corporation (CRC): Free Stock Analysis Report
Marathon Oil Corporation (MRO): Free Stock Analysis Report
Original post
Zacks Investment Research