
Chinese energy giant PetroChina Co. Ltd. (NYSE:PTR) announced first-quarter 2017 earnings of RMB 5,699 million or RMB 0.03 per diluted share compared with a loss of RMB 13,786 million or RMB 0.08 per diluted share a year earlier.
Earnings per ADR came in at 44 cents. Moreover, China’s dominant oil and gas producer’s total revenue for the quarter rose 40% from the year-ago period to RMB 493,559 million.
The positive comparisons can be primarily attributable to higher oil prices, which helped its biggest unit – exploration and production – to swing to profitability.
PetroChina followed other big energy names from the country – CNOOC Ltd. (NYSE:CEO) and Sinopec (NYSE:SNP) – in reporting encouraging results.
PetroChina Company Limited Price, Consensus and EPS Surprise
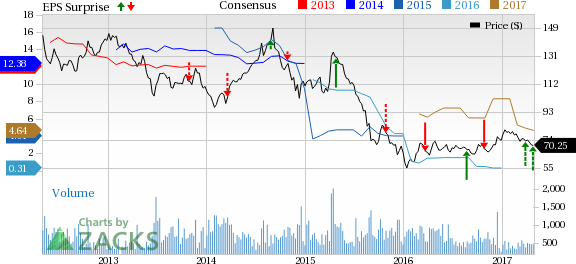
PetroChina Company Limited Price, Consensus and EPS Surprise | PetroChina Company Limited Quote
Segment Performance
Upstream: PetroChina, one of the world's largest oil company by market value and 40% the size of ExxonMobil Corp. (NYSE:XOM) , posted disappointing upstream output during the three months ended Mar 31, 2017. In particular, crude oil output – accounting for 59% of the total – fell 10.7% from the year-ago period to 216.8 million barrels (MMBbl).
Marketable natural gas output was up by a meagre 0.9% to 899.8 billion cubic feet (Bcf). As a result, PetroChina’s total production of oil and natural gas declined 6.3% year over year to 366.8 million barrels of oil equivalent.
However, average realized crude oil price during the first quarter of 2017 was $51.34 per barrel, representing an 88.3% jump from the year-ago period. This buoyed the upstream (or exploration & production) segment results, which posted an operating income of RMB 1,916 million – turning around from the year-ago operating loss of RMB 20,268 million. A tight leash on unit operating costs, that decreased 2.9% compared with the same period of last year, also helped results.
Downstream: The Beijing-based company’s ‘Refining & Chemicals’ business generated an operating income of RMB 8,177 million. This is down 44% from the year-earlier period earnings of RMB 14,651 million. The deterioration in the downstream division was due to tough market conditions.
PetroChina’s refinery division processed 245.6 MMBbl of crude oil during the three-month period, down 0.6% from 2016. The company produced 2,327 thousand tons of synthetic resin in the period (a fall of 0.3% year over year), besides manufacturing 1,451 thousand tons of ethylene (up 2.1%). It also produced 22,205 thousand tons of gasoline, diesel and kerosene during the period against 22,312 thousand tons a year earlier.
Natural Gas & Pipelines: A rise in natural gas sales and prices helped the Chinese behemoth’s segment earnings. And though PetroChina lost money to the tune of RMB 5,984 million on the sales of imported natural gas and liquefied natural gas (LNG) from Central Asia and Burma, the losses were narrower compared with the first quarter of 2016.
All these factors drove the Zacks Rank #5 (Strong Sell) group’s natural gas business’ income to RMB 9,882 million in the period under review, a substantial improvement from the year-earlier profit of RMB 4,717 million. You can see the complete list of today’s Zacks #1 Rank (Strong Buy) stocks here.
Marketing: In marketing operations, the state-owned group sold 38,639 thousand tons of gasoline, diesel and kerosene during Jan–Mar 2017, an increase of 4.1% year over year. Greater volumes were accompanied by expanded refined products exports, stress on high-margin products and numerous marketing initiatives.
As a result, PetroChina was able to counter the adverse factors – slow domestic refined products demand growth, low prices and fierce competition – to post a profit of RMB 2,922 million compared to just RMB 426 million recorded in the same period last year.
Liquidity & Capital Expenditure
At the end of the quarter, the stock’s cash balance was RMB 96,318 million, while cash flow from operating activities was RMB 72,988 million. Capital expenditure for the three months reached RMB 40,332 million, down 20% from the year-ago level.
Sell These Stocks
Now. Just released, today's 220 Zacks Rank #5 Strong Sells demand urgent attention. If any are lurking in your portfolio or Watch List, they should be removed immediately. These are sinister companies because many appear to be sound investments. However, from 1988 through 2016, stocks from our Strong Sell list have actually performed 6X worse than the S&P 500. See today's Zacks "Strong Sells" absolutely free >>.
China Petroleum & Chemical Corporation (SNP): Free Stock Analysis Report
CNOOC Limited (CEO): Free Stock Analysis Report
PetroChina Company Limited (PTR): Free Stock Analysis Report
Exxon Mobil Corporation (XOM): Free Stock Analysis Report
Original post
Zacks Investment Research