This morning the National Association of Realtors released the March data for their Pending Home Sales Index. Here is an excerpt from the latest press release:
Lawrence Yun, NAR chief economist, says sparse inventory levels caused a pullback in pending sales in March, but activity was still strong enough to be the third best in the past year. "Home shoppers are coming out in droves this spring and competing with each other for the meager amount of listings in the affordable price range," he said. "In most areas, the lower the price of a home for sale, the more competition there is for it. That's the reason why first-time buyers have yet to make up a larger share of the market this year, despite there being more sales overall." (more here).
The chart below gives us a snapshot of the index since 2001. The MoM change came in at -0.8%. Investing.com had a forecast of -0.1%.

Over this time frame, the US population has grown by 14.4%. For a better look at the underlying trend, here is an overlay with the nominal index and the population-adjusted variant. The focus is pending home sales growth since 2001.

The index for the most recent month is 12% below its all-time high in 2005. The population-adjusted index is 20% off its 2005 high.
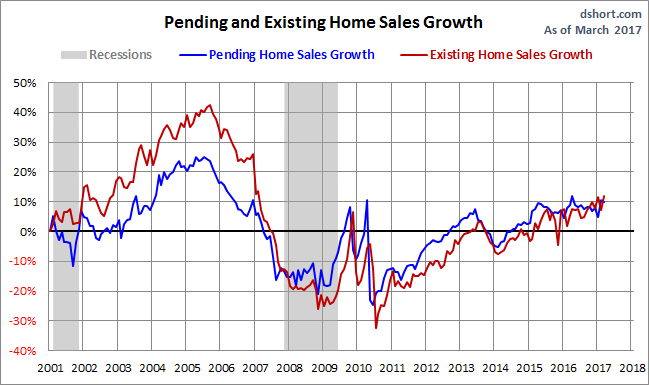
Pending versus Existing Home Sales
The NAR explains that "because a home goes under contract a month or two before it is sold, the Pending Home Sales Index generally leads Existing Home Sales by a month or two." Here is a growth overlay of the two series. The general correlation, as expected, is close. And a close look at the numbers supports the NAR's assessment that their pending sales series is a leading index.