Enterprise software applications company Pegasystems Inc. (NASDAQ:PEGA) stock hasn’t slowed down despite the pandemic smashing through its pre-COVID highs to handily outperform the benchmark S&P 500 index ((NYSE:SPY)). The Company continues to successfully transform its legacy brand into a leading enterprise cloud company providing integrated CRM and BPM applications.
While the Company is considered a pandemic benefactor, it’s the post-pandemic return-to-work and high-touch customer engagement functions of the recovery to normalcy that can boost growth. With the global distribution of COVID-19 vaccines rolling out this month, prudent investors should watch for opportunistic pullback levels to gain exposure on this adaptive and nimble player.
Q3 FY 2020 Earnings Release
On Oct. 28, 2020, Pegasystems released its fiscal third-quarter 2020 results for the quarter ending September 2020. The Company reported an adjusted earnings-per-share (EPS) loss of (-$0.33), missing consensus analyst estimates for EPS loss of (-$0.07), by (-$0.26). Revenues grew by 4.3% year-over-year (YOY) to $225.95 million falling short of analyst estimates for $249.86 million. While the initial results fell short, the key internal metrics were impressive. Pega Cloud annual contract values (ACV) rose 57% YoY to $232 million while total ACV grew 21% to $777 million. Backlog rose to $838 million, up 38% YoY. Pega Cloud client mix comprised of 68% new client commitments in the quarter. The Company ended the quarter with $450 million in cash and cash equivalents.
Conference Call Takeaways
Pegasystems CEO, Alan Trefler, emphasized the Company’s software being the “engine that makes solutions clearer, relationships smoother and helps our clients delight their customers and bring siloed teams together.” The Company has leaped ahead of Salesforce.com (NYSE:CRM) in the Forester Prestige real-time interaction management wave driven by the latest version of the Pega Infinity product suite.
Migration to the cloud and profound digital transformation are the top initiatives for its clients. The Company started its own acceleration to the cloud model that perpetually sold software licenses to selling recurring cloud arrangements with Pega Cloud in 2018. The transition is 60% completed with all new clients primarily subscribing to Pega Cloud, resulting in more transparent recurring revenues. For the first nine months of 2020, 90% of software revenue is recurring. Complete cloud transition is expected by 2023. Margins have improved 1,500 basis points rising to 64% in Q3 2020 versus 49% in Q3 2019. The Company has nearly 100% of its workforce working remotely, which is a testament to the agility of its ecosystem. Business was strongest in the traditional areas of financial services, government, telecom, healthcare, insurance and industries, which proved resilient throughout the pandemic. Pega excels in process automation enabling government agencies to speed up the handling of simple to complex tasks such as census survey processing for the U.S. Census Bureau. CEO Trefler provided many client case studies including CIBC migrating to Pega Cloud for their system “to be used to support more than 11 million customers across 30,000 bank personnel. It will connect everything all facets from onboard to account servicing.” Prudent investors seeking to gain exposure with a stalwart cloud player ahead of its full transition to cloud can look for opportunistic pullbacks, patiently.

PEGA Opportunistic Pullback Levels
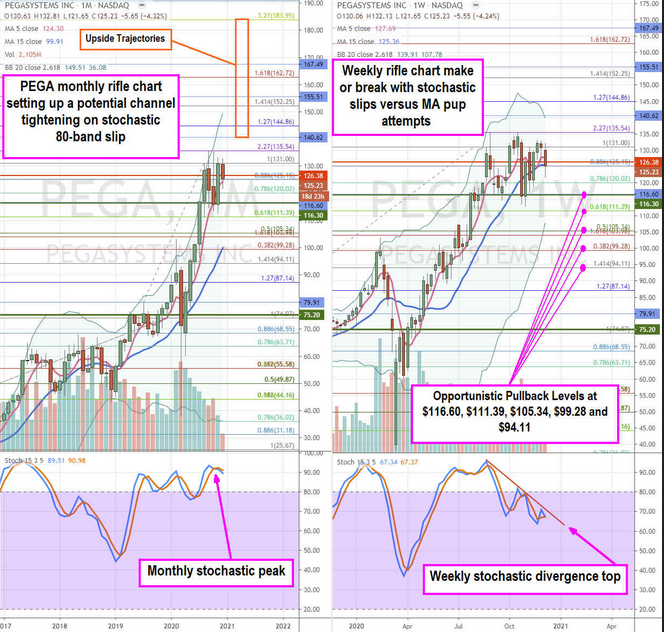
Using the rifle charts on the monthly and weekly time frames provides a broader complete perspective of the landscape for PEGA stock. The monthly rifle chart is in a stalled uptrend as shares have been peaking near the $135.54 Fibonacci (fib) level. The monthly stochastic formed a crossover down near the 90-band as the monthly 5-period moving average (MA) support attempts to hold at $124.30. The weekly rifle chart formed a market structure low (MSL) buy trigger above $75.20 in March. More recently the daily formed a MSL trigger above $116.60 and also a market structure sell (MSH) trigger below $126.58. The weekly rifle chart has been trying to form a pup breakout but the weekly stochastic continues to form a divergence top as each stochastic crossover up fails consecutively at lower bands. The smothering weekly stochastic can provide opportunistic pullback levels at the $116.60 daily MSL trigger, $111.39 fib, $105.34 fib, $99.28 fib and the $94.11 fib. The liquidity is rather thin as PEGA only trades a few hundred thousand shares at most daily, therefore patience and scaling into exposure on pullbacks is key. The upside trajectories range from the weekly upper BBs at $141.62 up towards the $180.95 fib.
