T2108 Status: 64.0% (ends 3-day overbought period)
T2107 Status: 64.5%
VIX Status: 11.6
General (Short-term) Trading Call: cautiously bearish
Active T2108 periods: Day #221 over 20%, Day #41 over 30%, Day #40 over 40%, Day #38 over 50%, Day #32 over 60% (overperiod), Day #1 under 70% (underperiod, ends 3-day overbought period)
Commentary
In my last T2108 Update, I described a surprising bearish divergence for the S&P 500 (via SPDR S&P 500 (NYSE:SPY)). Monday's edition confirms the bearish divergence with the tech sector providing a lingering protest.
T2108, the percentage of stocks trading above their respective 40DMAs, plunged out of overbought conditions and closed at 64.0%. This move was a one-month closing low. The S&P 500 (SPY) fell fractionally at 0.4%. I would have expected a bigger drop except for the mildness of the move the previous day.
Note that both Powershares S&P 500 Low Volatility Portfolio (NYSE:SPLV) and Powershares S&P 500 High Beta Portfolio (NYSE:SPHB) fell further than the S&P 500 (-0.8% and -1.0% respectively) and seemingly confirmed the bearish turn of events. However, the NASDAQ (via PowerShares QQQ Trust Series 1 (NASDAQ:QQQ)) was an important holdout.
The tech-laden index managed to print a small 0.2% gain with Apple (NASDAQ:AAPL) leading the way with a 0.9% gain and a new 52-week high. Facebook (NASDAQ:FB) was one of the important big-cap tech stocks that managed to beat out Apple on the day. Together, they stood up and out against the otherwise accumulating bearish evidence.
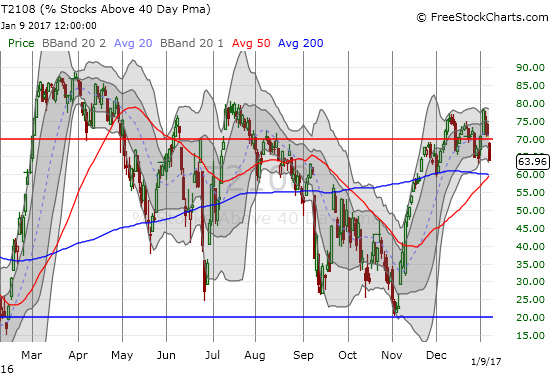
T2108 dropped sharply out of overbought territory (70%)
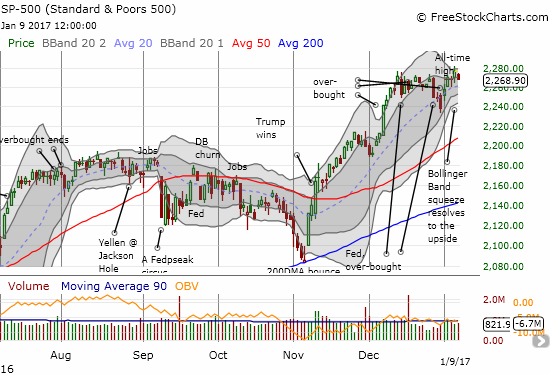
The S&P 500 (SPY) fell marginally in a very mild confirmation of the previous day’s bearish divergence.
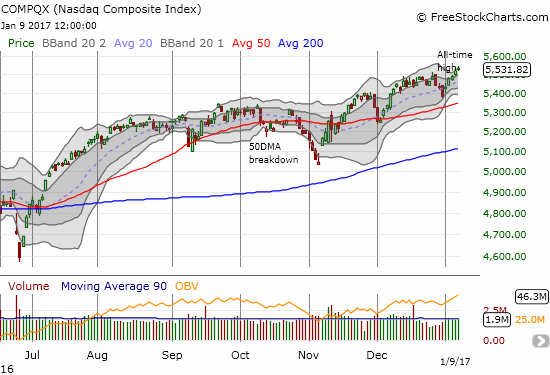
Yet the NASDAQ (QQQ) did not join the selling and instead printed a fresh (marginal) all-time high.
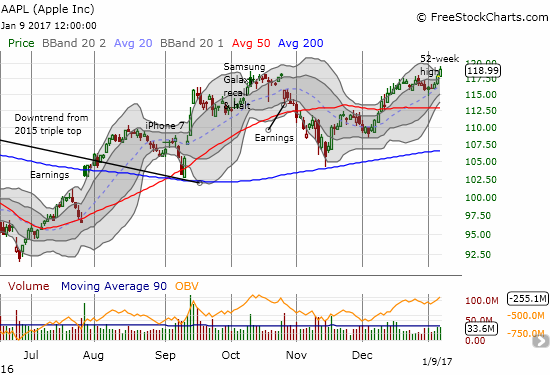
Apple (AAPL) helped lead the way for the NASDAQ with a 52-week high.
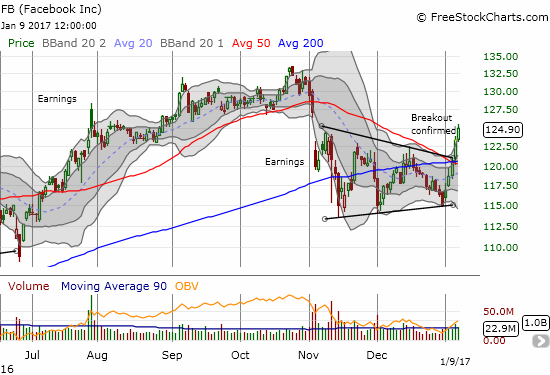
Facebook (FB) lent a helping hand with a 5th straight day of strong volume buying. FB has rallied every day of 2017 after having traded to the edge of a confirmed *breakdown*
Per my trading rules for overbought conditions, I am supposed to turn bearish upon a drop by T2108 below the 70% threshold for overbought. However, I am leaving the short-term trading call at cautiously bearish in deference to the otherwise impressive surges higher for AAPL and FB. They could be the flames flickering brightest before the darkness, but I will need to see confirmation of weakness to believe it fully (like a close below Monday’s lows).
The volatility index, the VIX, continued to scrape rock bottom. The VIX looks relatively unconcerned (unaware?) of the bearish hints in the market.
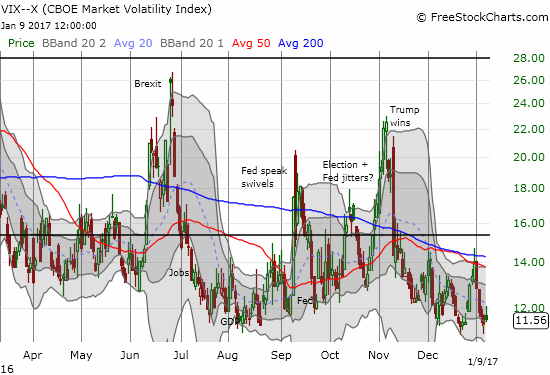
The volatility index remained little troubled by the bearish undertow (however mild).
NVIDIA Corporation (NASDAQ:NVDA) also delivered good news for tech bulls and bulls in general. NVDA gained an impressive 4.1% and confirmed support at its uptrending 20DMA. The stock finally looks like it is setting up to invalidate the bearish engulfing pattern triggered by negative research and commentary from Citron almost two weeks ago.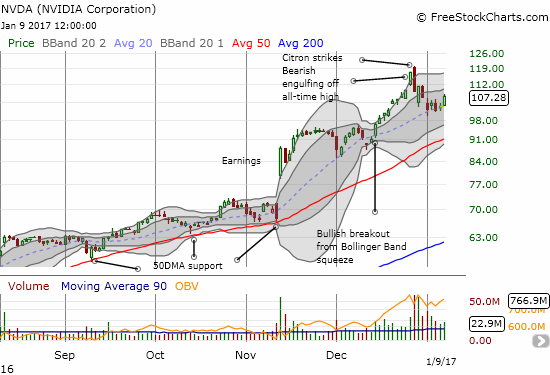
Nvidia (NVDA) looks like it is finally stabilizing and preparing for its next run-up.
So what delivered the strong pressure on T2108? I assume it was the energy sector. Last time retail and small cap stocks generated the bearish divergence that diverted me from following breakouts on the major indices. This time the Energy Select Sector SPDR ETF (NYSE:XLE) applied selling pressure almost all by itself. Interestingly 2017 trading volume still sits at Christmas/holiday levels.
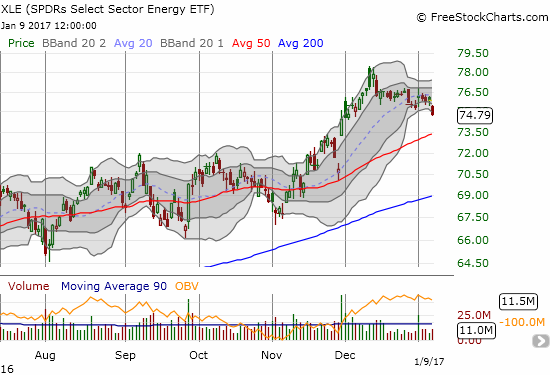
The Energy Select Sector SPDR ETF (XLE) dropped 1.5% in a move that further extended its downtrend from recent highs.
XLE’s drop is a continuation move of the weakness that started with the “gap and crap” on December 12th. That day marked an intraday high and then a closing high the following day. A test of 50DMA support seems likely.
With earnings season approaching, I will increase my caution further on interpreting the bearish technical signals. With T2108 vacillating so much around its overbought threshold, it is very possible that good earnings from just a few key companies could flip the bearish to bullish in short order.
Stay tuned.
Daily T2108 vs the S&P 500
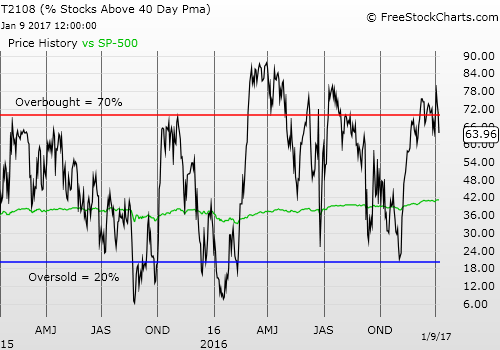
Black line: T2108 (measured on the right); Green line: S&P 500 (for comparative purposes)
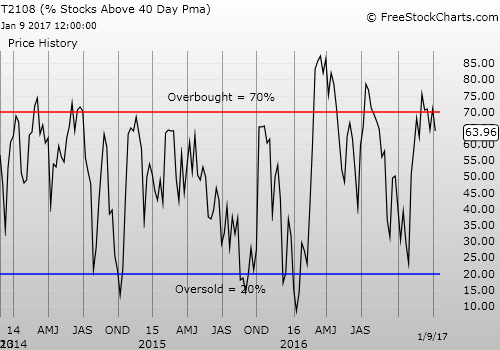
Red line: T2108 Overbought (70%); Blue line: T2108 Oversold (20%)
Weekly T2108
Be careful out there!
Full disclosure: long SDS, long and short positions on the U.S. dollar, long BBY put options
