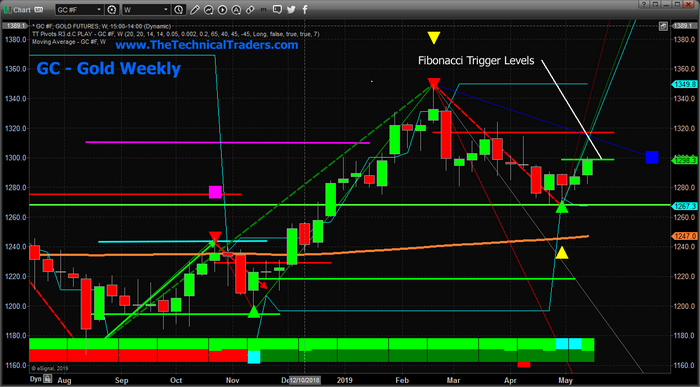
Over the past 6+ months, we’ve been covering the price rotations in precious metals very closely. We’ve issued a number of amazing calls regarding Gold and Silver over the past few months. Two of the biggest calls we’ve made were the late 2018 research post that suggested Gold would rally to above $1300, then stall. The other amazing call was our research team’s suggestion that April 21~24 would see Gold setup an Ultimate Base, or what we were calling a “Momentum Base”, near $1250 to $1275.
We issued both of these markets calls many months in advance of these dates/price levels targeting these moves. In both cases, we issued these market calls well over 60 days prior to the move actually taking place. The accuracy of these calls can be attributed to our proprietary price modeling solutions as well as the skill and techniques of our research team. Don’t mind us while we take a few seconds to take credit for some truly amazing precious metals calls over the past 6+ months.
This Weekly Gold chart highlights just about everything we have been suggesting would happen over the past 12+ months. The rally in Gold from below $1200 to almost $1350 set up an upside price leg that we believe is still just beginning. The rotation lower, after the February 2019 highs, set up the Momentum Base near April 24 – RIGHT ON TARGET. Now, the upside price advance that we’ve been predicting should launch Gold well above the $1400 price level appears to be setting up.
The next leg higher for Gold will see a price peak near $1450 before another brief sideways/stalling pattern sets up. After that, our research suggests a rally will quickly drive Gold prices above $1550 (or much higher).

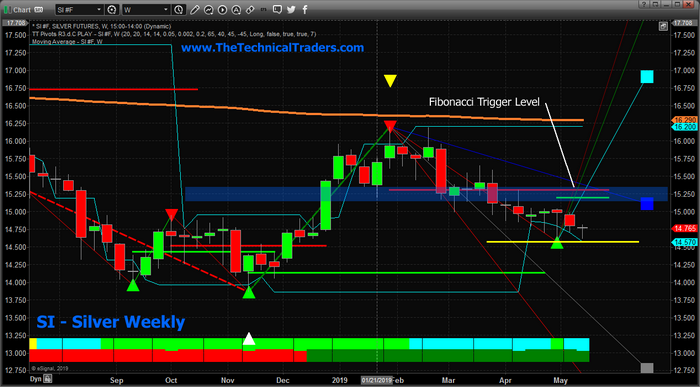
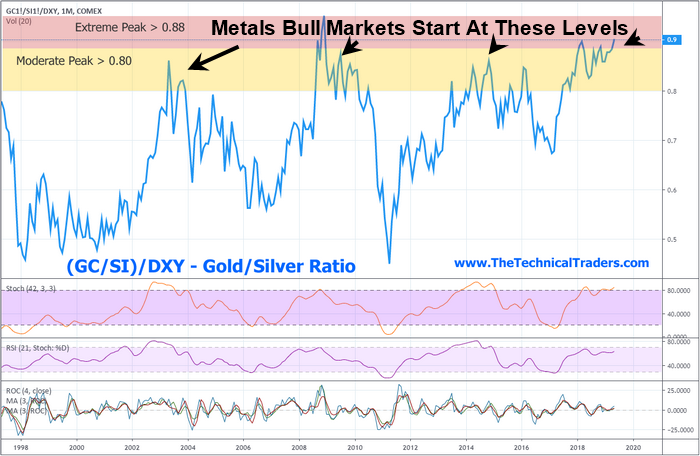
As we’ve been suggesting, Silver will likely lag behind Gold by about 20+ days. We believe Silver is going to see an incredible upside price move – even bigger than Gold in percentage terms. Our belief is that Silver will be trading above $26 to $28 per ounce – almost DOUBLE the recent low price level, when Gold will be trading just above $2000 per ounce. The reason for this is the relationship between the Gold/Silver/US dollar pricing levels – called the Gold/Silver Ratio. The chart is below
When the ratio is above 0.80, we consider this to be a “Moderate Peak” zone for Gold. Where the price of Gold (per ounce) represents more than 80 ounces of Silver. The ratio of the price of Gold to the price of Silver is a fairly common measure to determine when Silver is very undervalued compared to Gold. When the ratio typically falls above 0.80, then the price of Silver is very cheap compared to the price of Gold. When this ration move above 0.90, these levels are Extreme Peaks in the disparity of pricing between Gold and Silver. These are the areas where both Gold and Silver rally back to restore a ratio level closer to 0.60 or 0.65 (or lower).
This would indicate that the price of Silver will rally much faster than the price of Gold and in order for this ratio to move back to the 0.06 level, Silver would have to rally at a rate of 1.35:1 or 1.45:1 compared to Gold.
This Weekly Silver chart highlights the levels we are watching for the upside breakout in Silver to begin – $15.40 or higher and we believe the upside price move in Silver till accelerate well above $18 per ounce very quickly. Again, the move in Silver will likely lag behind Gold by at least 20+ days. So now if the time to buy Silver in physical form (or any form) as we prepare for this move. Once it starts, we can promise you that the rally will be impressive and quick.

Watch how Gold and Oil react over the next few weeks as Fear re-enters the global markets. Our belief is that Oil will fall while Gold initiates the first leg higher, towards $1400 to $1450 before stalling. Once this happens, we can be certain a new upside price advance is beginning in Gold and this could be a fairly strong indicator that the markets are weakening and there is increased global fear.

