While shares of database platform giant Oracle Corporation (NYSE:ORCL) shares have been recovered back to its pre-COVID levels, they’ve remained stagnant despite the historic rally in the benchmark S&P 500 index. While ORCL is a tech pioneer, the market has priced shares modestly at 18X earnings relegating it to a legacy brand. Attempts to break out fueled by a rumored bid for social media app TikTok were smothered out during the recent market sell-off. As money rotates from momentum into value, Oracle may see money flow as a tech value play as it trades at a severely discounted multiple compared to its software peers. Prudent value investors should watch for opportunistic pullbacks for exposure to this sleeping giant.
Q4 FY 2020 Earnings Release
On June 4, 2020, Oracle released its fourth-quarter fiscal 2020 results for the quarter ending May 2020. Oracle reported earnings-per-share (EPS) of $1.20 versus consensus analyst estimates for a profit of $1.16, a $0.04 per share beat. Revenues fell (-6.3%) year-over-year (YoY) to $10.44 billion falling short of consensus estimates of $10.72 billion. Cloud services and license support top line improved 1% YoY to $6.8 billion. Non-GAAP operation margins were 49%. The Fusion Cloud ERP Suite offering grew 35% YoY and Fusion Cloud HCM Suite grew 29% YoY. The company stated results were hampered by the pandemic causing clients in the hardest-hit industries such as retail, hospitality and transportation to postpone purchases. Oracle anticipates a strong upgrade cycle for its largest clients that have not yet moved to the cloud which include governments and banks.
Conference Call Takeaways
The company broke down the segments on the call with License revenues down (-21%) YoY after being up 15% the prior quarter. The company moved to cut expenses by 8% as the pandemic began to take hold resulting in driving up operating margins by 2% YoY to 49%. It generated $11.6 billion in free cash flow over the prior four quarters resulting in a liquidity position of $43 billion in cash and securities and a short-term deferred revenue balance of $8 billion at the end of fiscal 2020. Oracle updated forward guidance for total revenues growing between flat to 2% in constant currency. Non-GAAP EPS in constant currency is expected growth between 5% to 9% or $0.85 to $0.89. The ccompany closed two major clients this quarter Zoom Video Communications Inc (NASDAQ:ZM) and 8X8 (NYSE:EGHT).
Jedi Contract Ruling
Oracle’s dispute over the 10-year $10 billion U.S. JEDI contract against the Pentagon concluded on Dept. 2, 2020. The Company lost its dispute as a Court of Federal Claims confirmed the original ruling that Oracle was neither harmed by any errors in the proposal development or potential conflicts of interest by Amazon (NASDAQ:AMZN) . The Court also stated that Oracle would never have qualified for the contract. Amazon was irrelevant since Microsoft (NASDAQ:MSFT) won the award fairly. This was old news are not material to Oracle.
TikTok Rumors
Oracle shares surged to all-time highs when rumors of a bid for TikTok emerged. The bid was composed of a $20 billion cash and stock deal with 50% of TikTok profits heading back to parent company ByteDance. The initial surge to $59.30 eventually lost interest as analysts deemed the acquisition would make very little sense. TikTok has until Sept. 15, 2020, to find a U.S. buyer for the domestic operations or run the risk of operational shutdown in the U.S. The significance of these events illustrates the pliability of Oracle shares to actually make new highs and the hunger for an innovative high growth element desperately needed to spark excitement with investors. A slow grind back towards TikTok triggered highs can set up a new leg breakout with the recent market muscle memory still intact. The pullback presented by the sell-off can provide opportunistic entries for value investors especially if technology stocks continue to see money rotate into value.

ORCL Opportunistic Pullback Price Levels
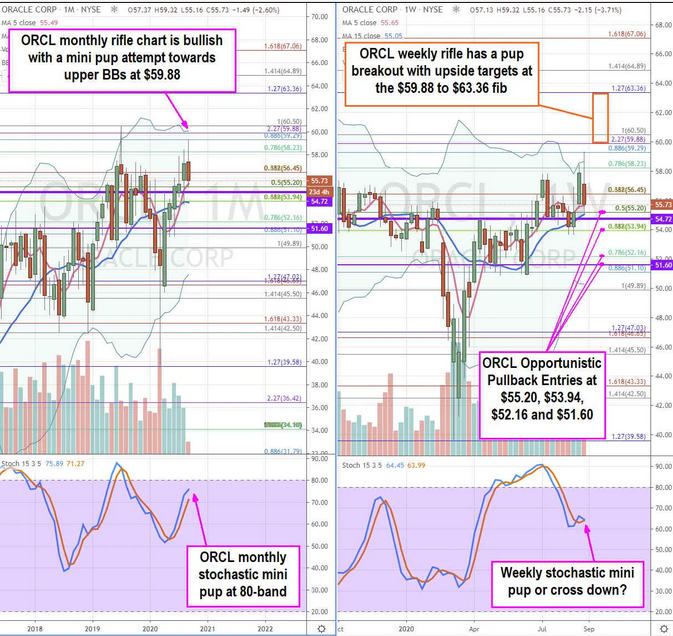
Using the rifle charts on the monthly and weekly time frames provides a broader view of the landscape for ORCL stock. The monthly rifle chart attempting bullish stochastic mini pup near the 80-band with 5-period and 15-period moving averages (MAs) at $55.49 and $53.84, respectively. The mini pup targets the upper Bollinger Bands (BBs) at the $59.88 Fibonacci (fib) level. The weekly market structure low (MSL) buy triggered above $51.60 and the monthly MSL triggered above $54.72. The weekly stochastic is stalled and will either mini pup up or cross down. The weekly stochastic cross down or reversion after tagging the $58.23 fib on news or earnings reaction can provide opportunistic pullback entry levels at the $55.20 monthly 5-period MA and fib, $53.93 monthly 15-period MA and fib, $52.16 fib and $51.60 weekly MSL level. While ORCL is a tech stock, it may benefit from the money rotation into value plays especially when trading at such low multiple compared to software peers like Salesforce (NYSE:CRM) and Workday (NASDAQ: NASDAQ:WDAY).
