On May 21, I reported on the rather low equities only put/call ratio ($CPCE, EO-PC). See my article here.
Based on historical data, I found downside risk outweighed upside reward. The dotted red vertical line in Figure 1 shows May 21.
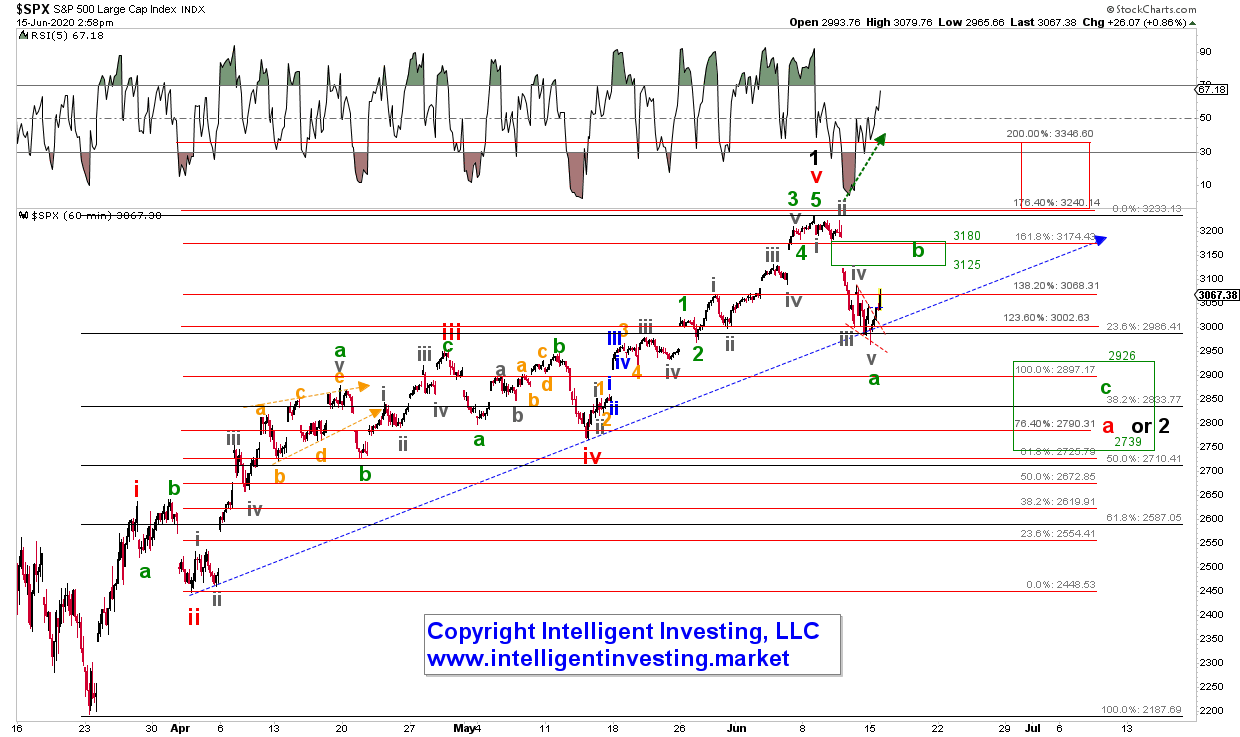
Figure 1. Daily Equities Only Put/Call ratio
Fast forward, and the S&P 500 topped on June 8 at SPX3233 with an OE-PC ratio of 0.37. Its lowest reading since 2010. Like in late-2019, the S&P 500 had rallied 10% since and lost almost all those gains over the last four trading days. Indeed, the risk/reward ratio was not favorable in late-May.
What is most surprising is the speed at which the OE-PC ratio dropped. It recorded its third-highest reading in history on March 12, and three months later its third-lowest reading in history. The 10-day Exponential Moving Average (10d EMA) of the OE-PC, see Figure 2 below, shows that historically a move from greater than 0.85 to less than 0.50 took at least a year (red boxes). Now it took only three months (blue boxes). Hence, the extreme shift in sentiment (from extremely Bearish to extremely Bullish) was unprecedented, which leaves little room for a fair historical comparison. But we’ll have to work with what the market gives us.
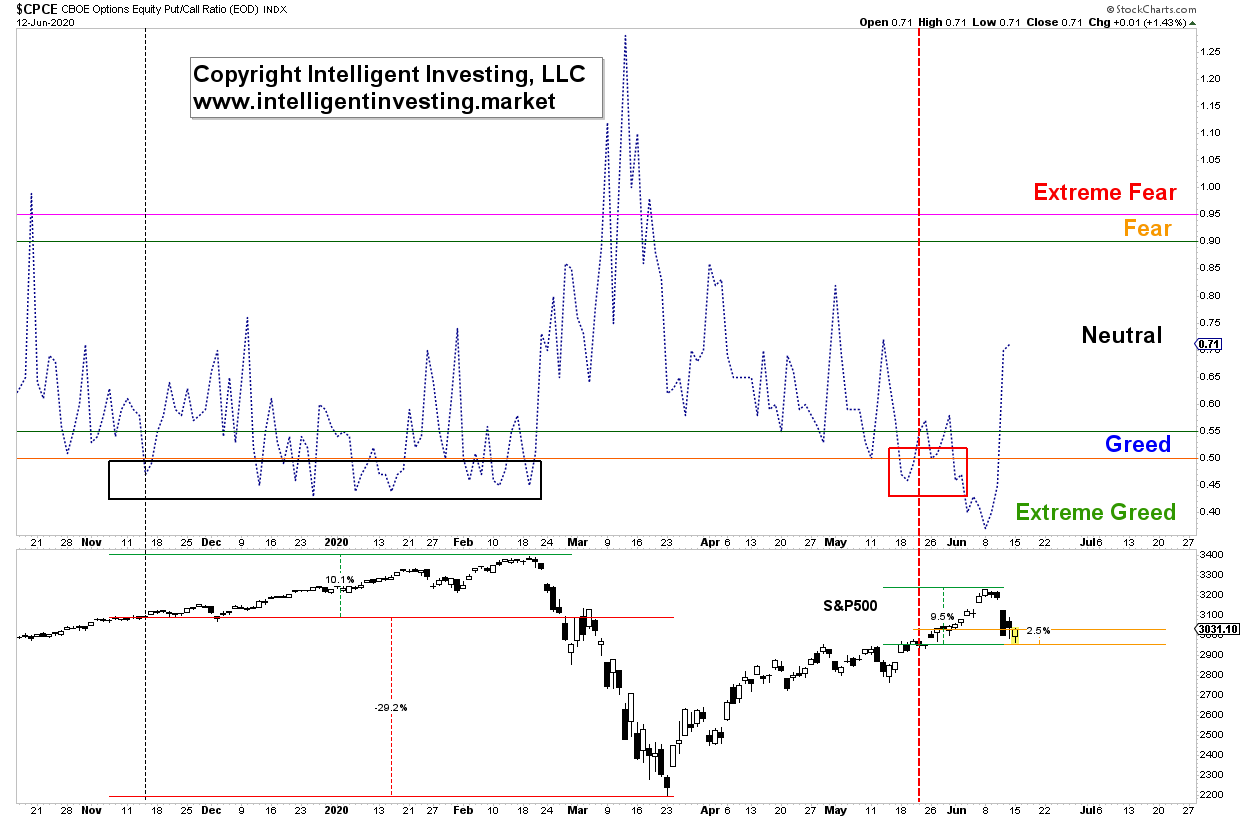
Figure 2. 10-Day Exponential Moving Averages of the Daily Equities Only Put/Call ratio
Namely, with only four occasions where the 10d EMA bottomed “directly” less than 0.50 after peaking above 0.85, and only one other time where the 10d EMA bottomed below 0.45 (mid-April 2010), the pickings are slim. The latter may, therefore, be most relevant to today’s situation. Back then, the S&P500 saw a two months’ long 17% correction before moving higher for another year and topping out before a ~22% correction, which erased almost all those prior-year gains.
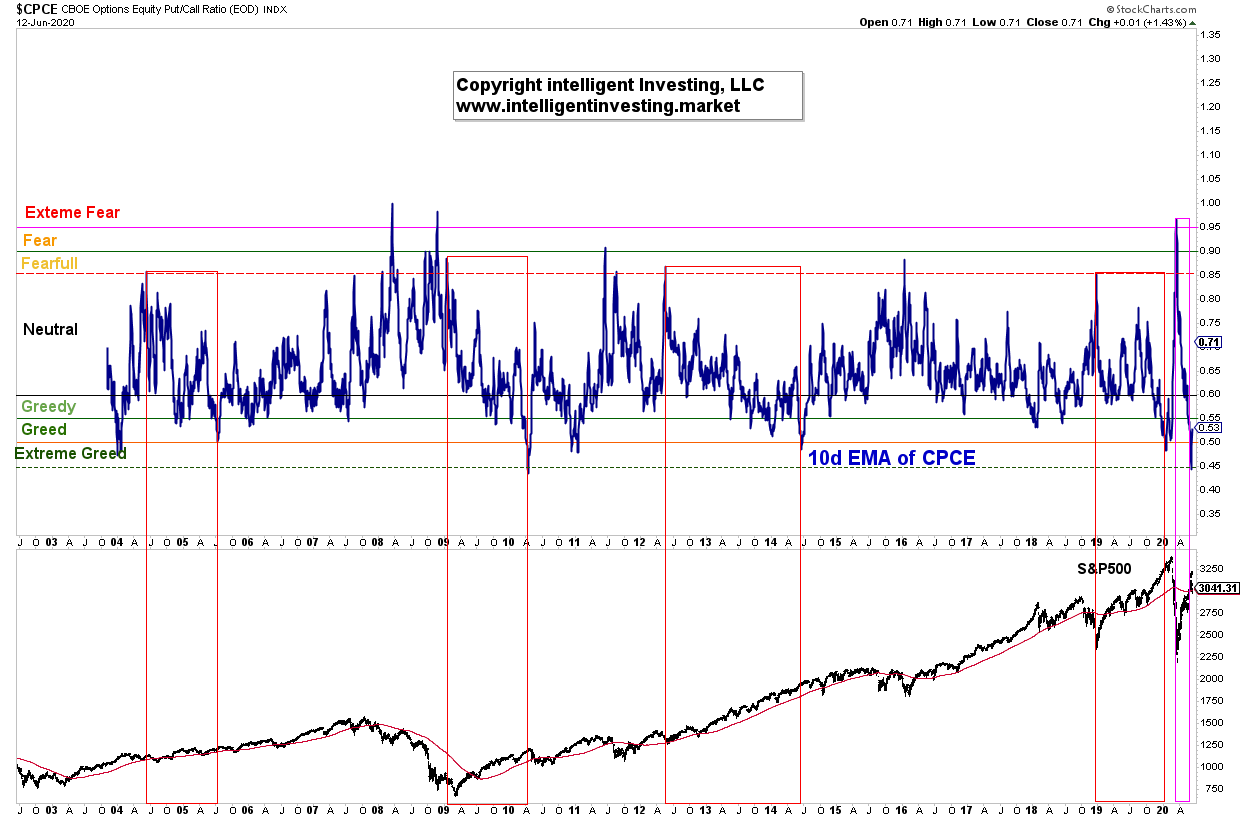
Corrections are often choppy affairs with lots of twists and turns, fast drops, and even quicker rallies, erased within a matter of days. For the current market, my Elliott Wave analyses suggest we will see a retrace back to ideally SPX3125-3180 before the next leg lower. See Figure 3 below for the longer-term bullish path I am tracking for the S&P 500.
Figure 3. Short-term Elliott Wave Count for the S&P 500